Contrast Transfer Accuracy (CTA)
Image Quality FactorsIntroduction
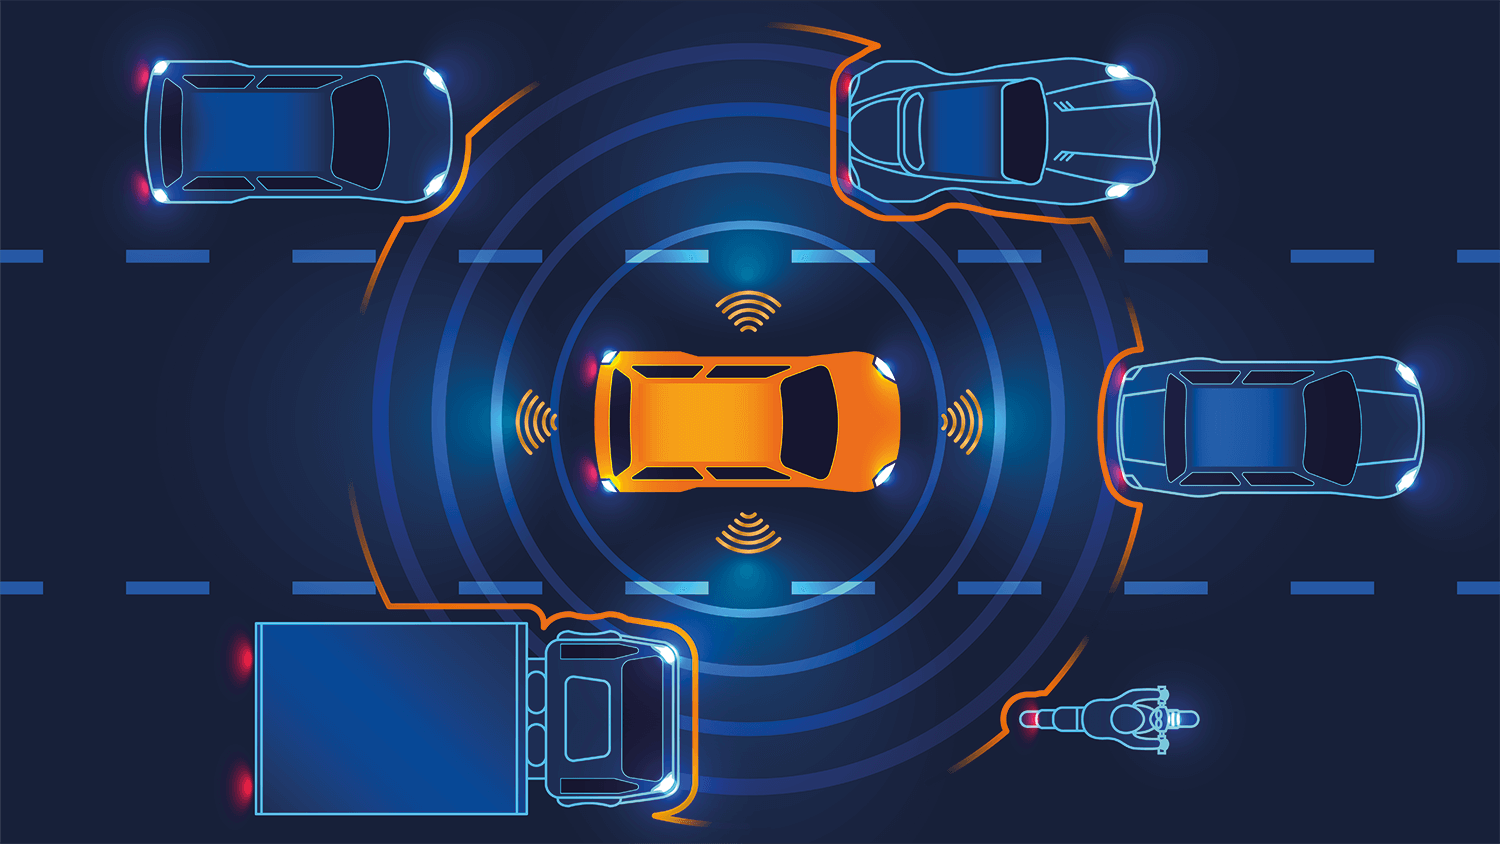
Contrast Transfer Accuracy (previously contrast detection probability - CDP) refers to the camera system's ability to correctly identify an object's contrast in its field of view. For example, advanced driver assistance systems (ADAS) must have the capability to identify different objects in their field of view. Without proper identification, the camera system may make an incorrect adjustment and create a dangerous situation. With that in mind, it is imperative to test the CTA of a camera system to ensure high performance and safety.
The background of CTA
Until recently, the automotive industry lacked international standards for testing and evaluating these camera systems' image quality. As a result, the IEEE-P2020 working group* was formed to establish parameters that will ultimately lead to the publication of an international standard on automotive image quality.1
At this time, the group has defined specific key performance indicators (KPIs), including CTA, and published a white paper that outlines the group's work towards an international standard for automotive image quality testing and specifications.2
CTA is the most important key performance indicator (KPI) that the group is currently working on. First presented by Dr. Marc Geese in 2018, CTA is designed to be independent of the components tested so a test team could use it to perform the same performance tests on different subsystems (e.g., lenses, sensors, windshields, etc.).
*Disclaimer: The opinions contained within the IEEE-P2020 working group solely represent the views of this working group and do not necessarily represent the position of either the IEEE or the IEEE Standards Association.
Why CTA over SNR?
Traditionally, SNR is used to describe a camera's performance when reproducing the contrast of a scene. However, for a setting with extremely high dynamic range, such as those often encountered by ADAS (e.g., a scene with flickering light), the SNR value is not the best indicator of full system performance in these situations.
SNR is a well-established metric that measures both the intended signal and the background noise that obscures the signal. Unfortunately, it is hard to link the SNR values directly to an application.
So, while most engineers are familiar with the required SNR for their industry, the values themselves still cannot be directly linked to an imaging system's task to detect a specific contrast under a particular condition. CTA, however, can provide this missing information and thus, vastly improve the design requirements that are now based around facts as opposed to a "best guess.3
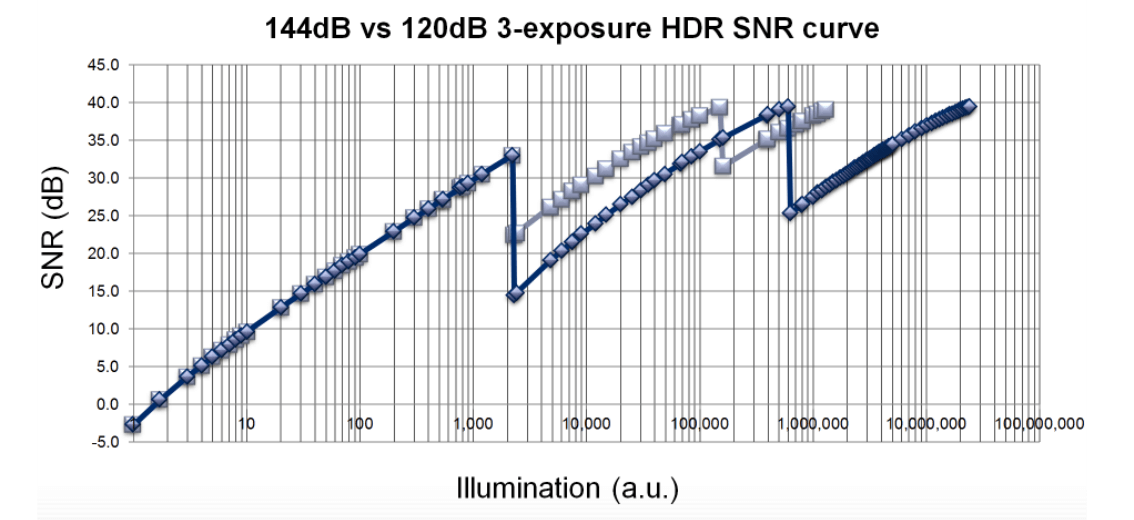
SNR drops are another issue that often appears in ADAS cameras. These drops are a phenomenon of a multi-exposure HDR algorithm that results in a non-linear SNR curve. This issue is especially prevalent in luminance regions where multiple images are combined, often leading to an SNR drop from an acceptable high value to a low critical value.
Additional issues with SNR also arise when predicting how an ADAS camera system will perform using an SNR value. The SNR drops, for instance, do not account for other elements in the scene, such as fog or dust between the camera and the object(s).
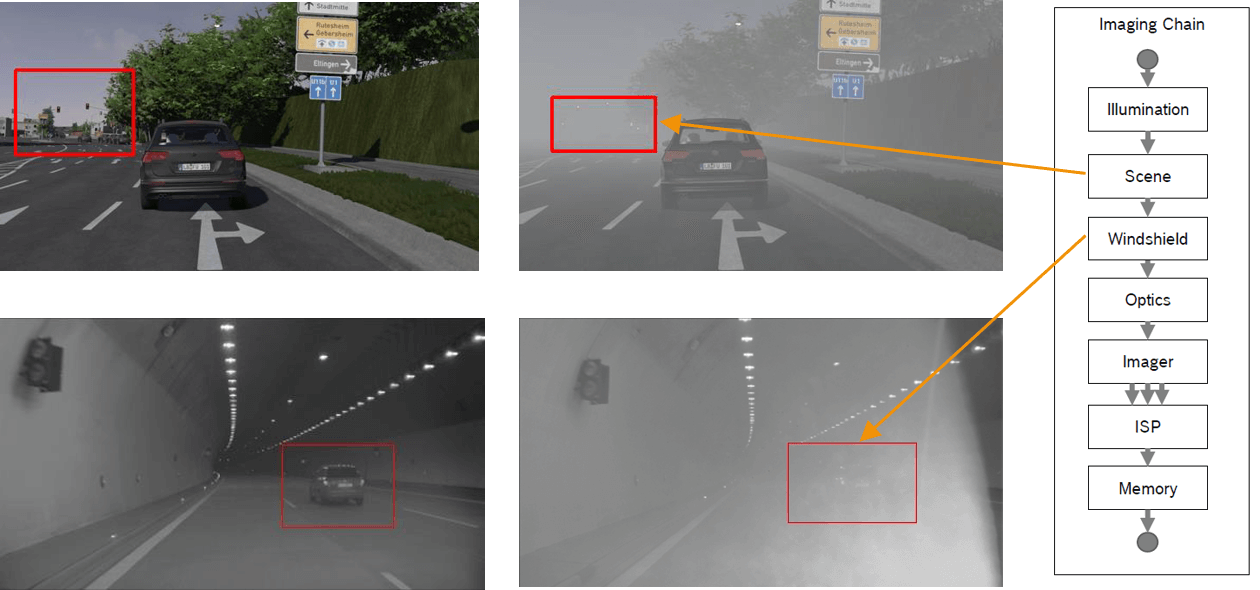
The development of CTA is a result of SNR being an inadequate performance measurement for the automotive industry. Unlike SNR, CTA directly links the system under test and can describe its performance regardless of the natural conditions. CTA can also provide an overview of multiple image quality components using the same metric.
Numerous tests are currently underway to support CDP/CTA as an internationally recognized test procedure for automotive camera systems.
How to test for CTA
As CTA is a relatively new concept, there are limited tools on the market that can measure and provide accurate results. For example, a typical image quality test setup using a test chart can only offer a limited number of data points in a synthetic scene. However, dynamic scenes, such as those experienced by automotive cameras, are better analyzed using numerous data points from the scene. To recreate dynamic scenes in a test lab, our engineers have developed the VLS
Versatile Light System (VLS)
With our first-hand knowledge of the IEEE-P2020 standard, we began developing new solutions to meet the testing demands. Our latest innovation is the Versatile Light System (VLS). The VLS is an illumination solution that creates a dynamic testing scene to efficiently measures CTA and other P2020 KPIs, including modulated light mitigation probability (MMP) and contrast signal-to-noise-ration (CSNR).
The VLS is a system of six Vega devices, each connected to an individual movable arm. All Vegas are linked via the arms to a tripod, offering high adaptability. The flexibility of the arms allows each Vega to be manually moved around to quickly generate randomized setups and angles during testing, allowing you to create a dynamic test scene.
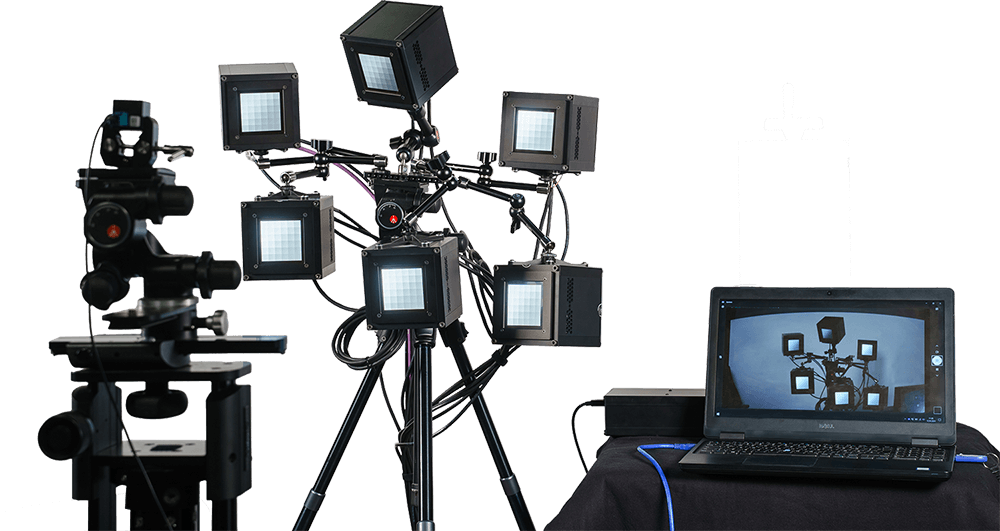
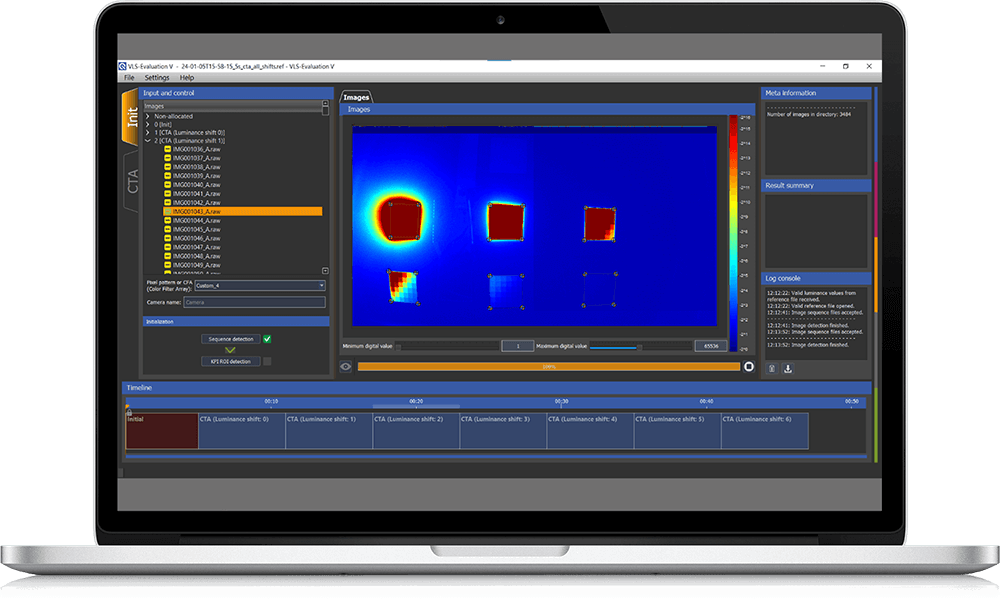
The VLS has control software that allows you to generate test sequences, increase or decrease the brightness, and activate flicker mode for MMP testing. In addition, the VLS-Evaluation software enables you to evaluate your test results.
Benefits of the VLS and its CTA evaluation
The VLS and its evaluation software give automotive companies a reliable way to characterize their systems and use the results to evaluate their designs' performance and safety in a test lab setting.
Other benefits include:
- Numerous data points for each measurement
- Eliminating the majority of road testing
- Validating the specifications of finished products
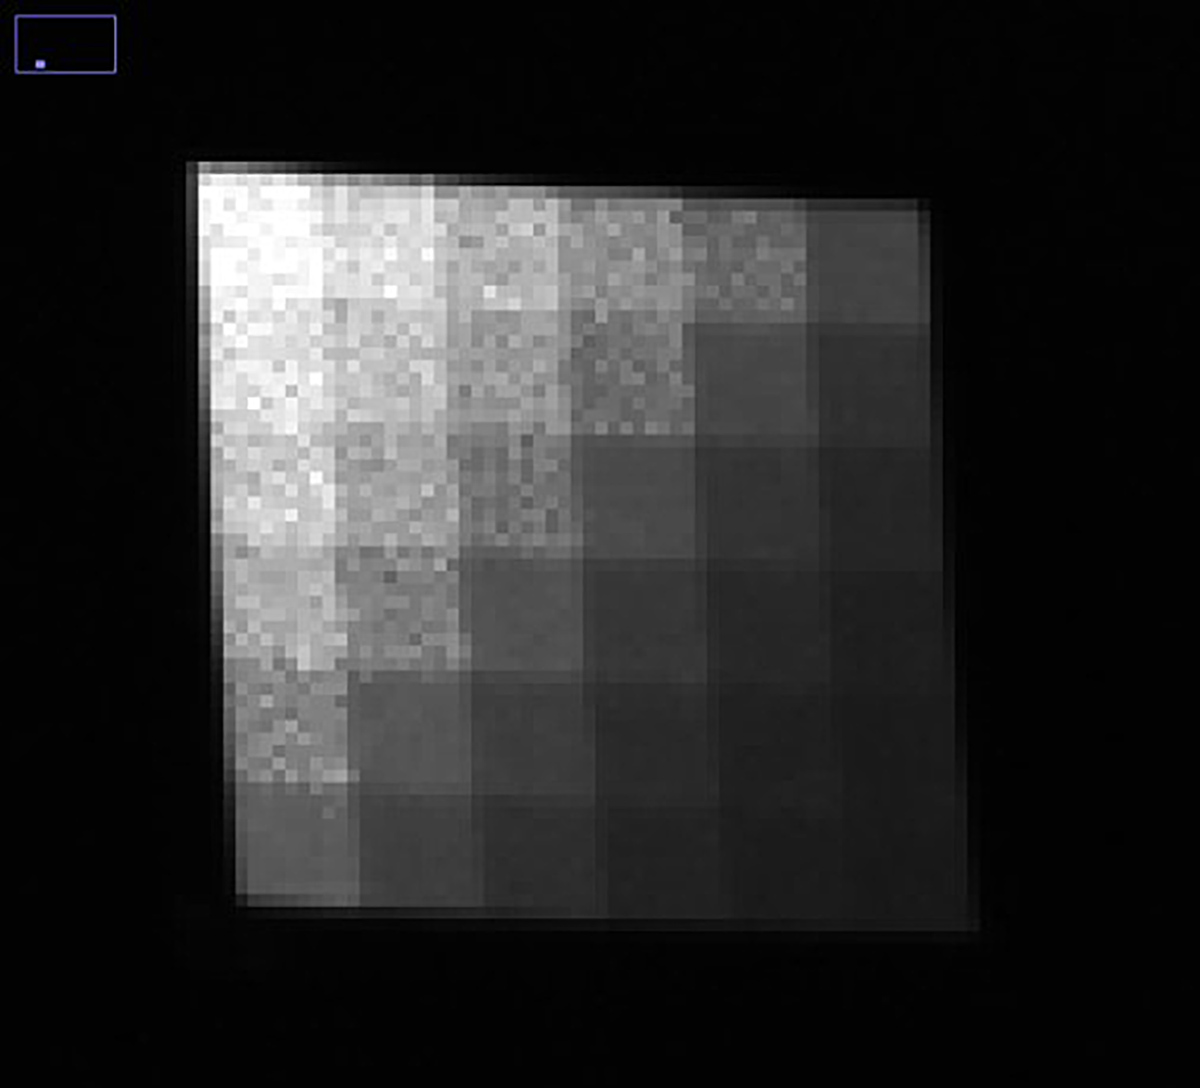
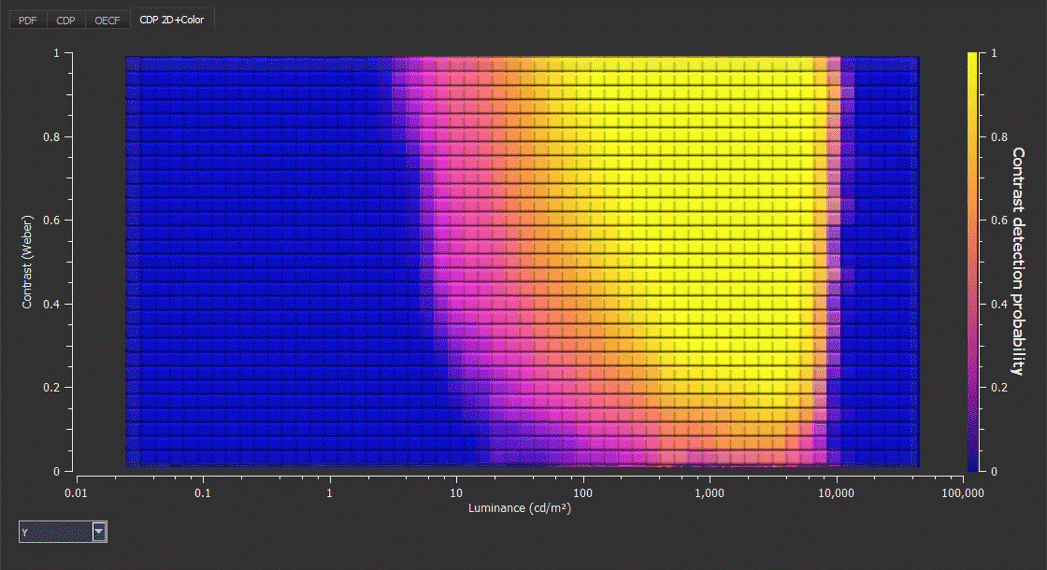
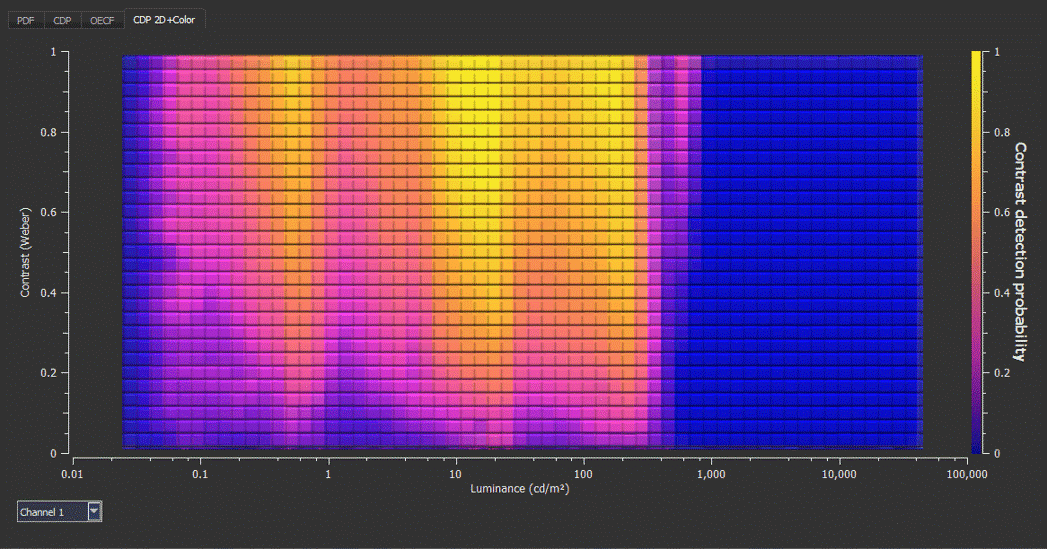
- It easily allows manufacturers to make specification requirements via heat maps
- Output .xml file with CTA, OECF, and PDF (probability density function) results
The VLS can also generate flickering light sequences to evaluate the camera system's response to changing light intensities. For more information, please see our flicker article.
Conclusion
Contrast transfer accuracy refers to an automotive camera system's ability to correctly identify an object's contrast in its field of view. Without proper identification, the system may make an incorrect adjustment and create a dangerous situation.
CTA is one of the current KPIs under development by the IEEE-P2020 working group. The group was formed to enact these testing parameters to lead to an internationally recognized automotive image quality standard eventually.
The Versatile Light System (VLS), one of the first CTA testing solutions on the market, has been developed in accordance with the proceedings of the IEEE-P2020 group. The VLS can generate a dynamic testing scene using 216 intensities at 120 dB to test a camera system's CTA performance. It is also equipped with CTA evaluation software that uses heat maps to show exactly how the system performs using different contrast and luminance.
The end goal of these automotive ADAS camera systems has always been to improve our daily transportation efficiency and safety. But before we can implement these systems into everyday vehicles, they must first be rigorously tested to ensure the avoidance of dangerous situations.

