Dynamic Range
Image Quality FactorsIntroduction
The dynamic range of an image describes the contrast in a scene that the camera can reproduce. More technically speaking, it is the maximum contrast a digital camera system can capture from its maximum output level (saturation) down to an even signal-to-noise ratio. Understanding dynamic range is crucial when evaluating camera performance. Often, camera systems are adequate at reproducing light areas of the scene but cannot produce the same quality in the darker areas. An insufficient dynamic range will lead to a loss of image quality.
Dynamic range is crucial in real-world photography, where scenes often contain a wide range of brightness levels. For instance, capturing the details of a brightly lit sky and the darker foreground in the same image can be challenging without a high-dynamic range camera. A high dynamic range (HDR) camera can capture more detail in shadows and highlights. In image quality testing, dynamic range is measured to evaluate a camera's ability to capture these changing lighting conditions.


Real-world use cases
Dynamic range of mobile phone cameras
Mobile phone cameras are expected to perform well in diverse lighting conditions, from bright sunlight to low-light environments. High dynamic range (HDR) capabilities in mobile cameras allow users to capture more detail in both shadows and highlights, leading to more visually appealing images.
Dynamic range in automotive cameras
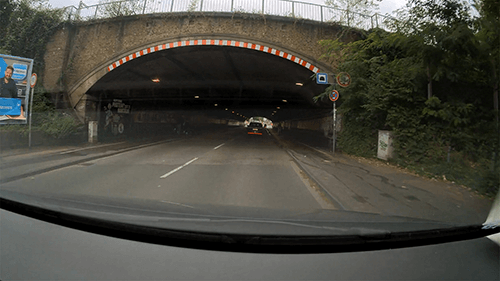
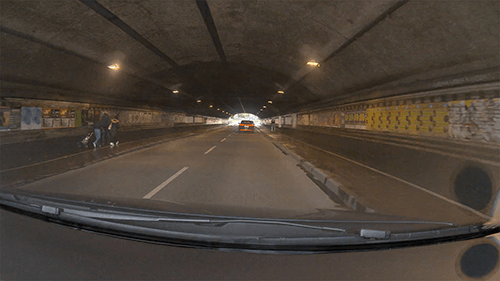
Automotive cameras require exceptional dynamic range, particularly in advanced driver-assistance systems (ADAS) and autonomous vehicles. They must also operate reliably in extreme lighting conditions, such as transitioning from a dark tunnel to bright sunlight or during nighttime driving when headlights and streetlights create high-contrast scenes.
Understanding dynamic range
The most critical step in determining a camera system's dynamic range is obtaining the OECF (opto-electronic conversion function). The OECF describes how a camera converts varying light levels (optical input) into electronic signals (digital output).
Once the OECF is acquired, you can determine the dynamic range of a camera system or the maximum and minimum contrasts that the system can reproduce. In addition to the dynamic range, the OECF is crucial when obtaining the signal-to-noise ratio for the different grey levels in the scene. It can also provide information regarding the white balance, the ISO speed of the camera, and whether a tonal correction has been applied to the image. A well-calibrated OECF ensures that the camera accurately captures a wide range of tones, essential for achieving a high dynamic range.
Determining the OECF
There are two methods to acquire the OECF of a camera system: the focal plane method and the scene-based method. Both generate the OECF from various sensor exposures.
Focal plane
The first step when using the focal plane method is removing the lens from the camera to expose the sensor to a light source directly. Once the sensor is free, the intensity of the light source must be gradually increased so the camera can capture images of, e.g., a grayscale target at multiple exposures. The OECF can be obtained by plotting the log exposure values against a mean digital value. The mean digital value comes from the corresponding images.
The focal plane method works well for more traditional cameras as the lens is easily removed, and the exposure can be controlled. However, removing the lens is impossible for other camera systems, e.g., mobile phones; thus, the focal plane method should not be used.
Scene-hased method
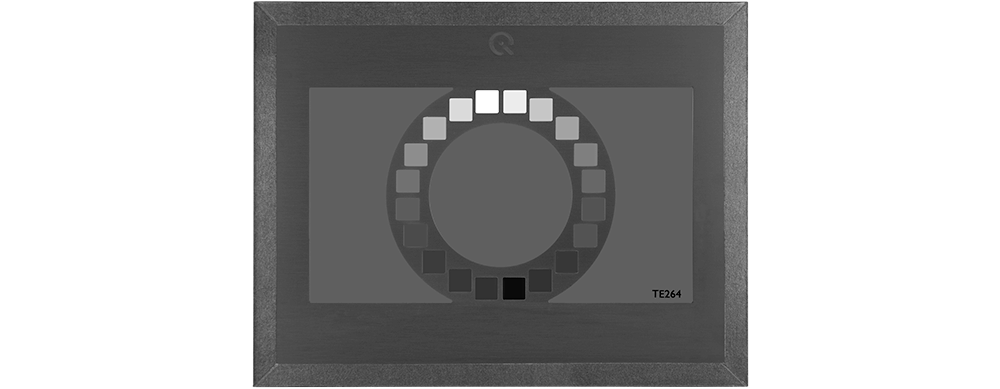
The scene-based method does not require lens removal and uses grayscale patches to determine the OECF. Typically, gray patches are circularly arranged on a test chart, e.g., TE264. The density of each patch is set using the calculated reference values from ISO 14524. Once the camera system captures an image, the OECF is determined by plotting the mean digital value of each patch against the corresponding log luminance.
Important international standards
ISO 14524
This ISO standard outlines the methods for measuring the OECF of a camera, which is directly related to dynamic range. It provides guidelines on how to set up the test environment, use test charts, and analyze the results.
ISO 15739
This standard focuses on noise measurements in digital cameras closely linked to dynamic range. It describes how to measure noise at different signal levels, making it essential for understanding a camera's performance across its dynamic range.
ISO 21550
This standard focuses on dynamic range measurement methods for electronic scanners often utilized in the archiving/cultural heritage industry to preserve documents and photographs.
Setting up a dynamic range test
Testing the dynamic range of a camera system involves standardized methods to ensure consistent and reliable results. In our iQ-Lab, we use the procedures outlined in the standards combined with advanced test equipment and test charts to evaluate dynamic range performance.
Test Charts
Test charts are one of the most common tools used in dynamic range testing. These charts typically consist of gray patches with known reflectance values ranging from light to dark. By capturing an image of a grayscale test chart, the camera's ability to reproduce different brightness levels can be evaluated based on its performance in distinguishing between the gray patches.
Grayscale test charts are available with multiple layouts to account for the varying requirements of different camera industries. For example, we offer the TE269 grayscale chart that organizes the gray patches in a circular layout instead of the TE259 test chart, which uses a horizontal layout of the gray patches. While both options are viable, the circular design is more advanced as it limits the effects of shading/vignetting.
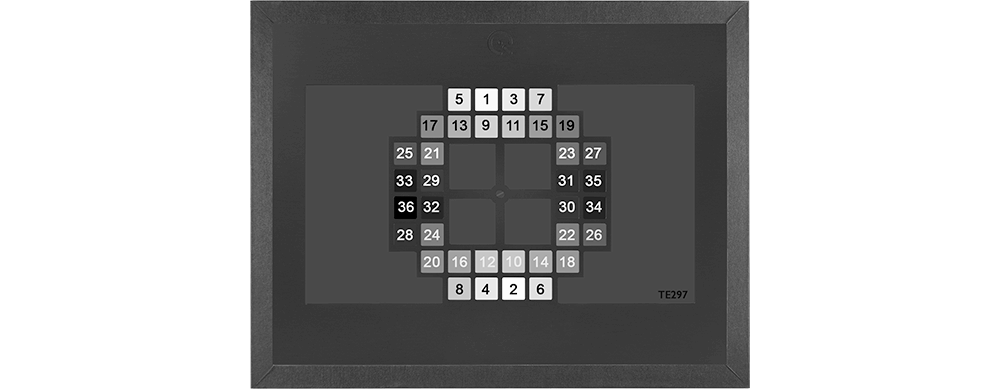
In addition, we offer grayscale charts for wide dynamic range measurements (TE297), which reorders the circular layout of the patches to minimize reflections that often appear when measuring wider dynamic ranges. We also offer grayscale charts for scanners (TE240) and multipurpose charts (TE42-LL) that have grayscale targets and other targets (e.g., color patches and Siemens stars) to test multiple image quality factors in one image.
Illumination devices
Most of our grayscale test charts, especially those with the circular patch layout, are transparent and require a uniform lightbox. We offer, and our iQ-Lab regularly uses, the LE7 lightbox powered by iQ-LED technology. This technology allows you to generate custom spectra to efficiently test under varying light levels (essential for dynamic range testing) using a single light source.
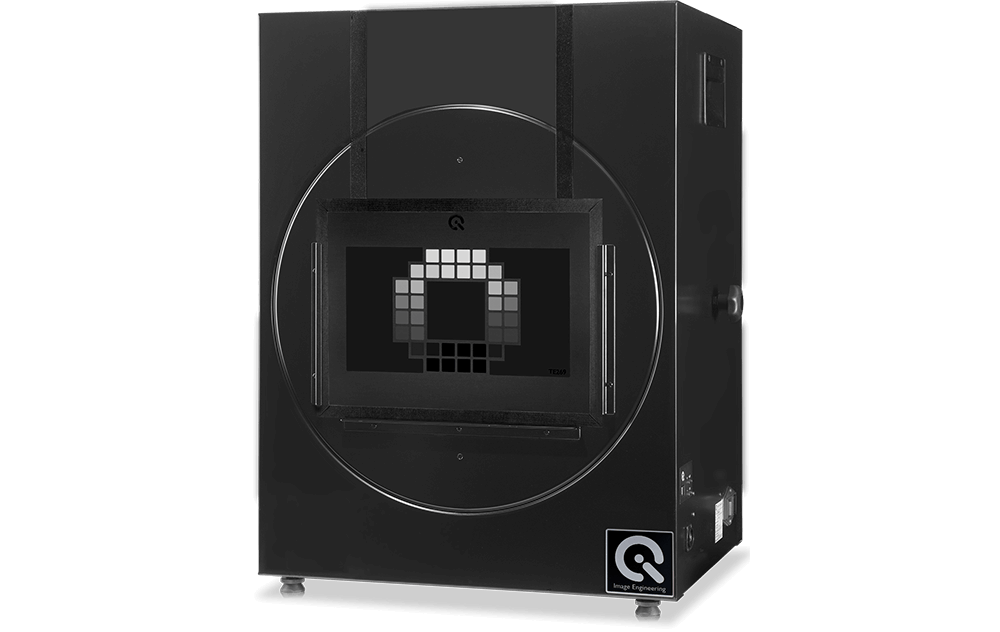
We also offer the Vega light source for dynamic range measurements according to the IEEE-P2020* standard. This standard is in the process of becoming the first internationally recognized standard that defines key metrics and establishes test methods for automotive image quality performance. One of these metrics is contrast transfer accuracy (CTA).
We use the Vega light source for high-precision measurements of very short exposure times often seen in automotive-grade cameras. Vega is equipped with specialized grayscale charts (TE294) for these measurements. Furthermore, our VLS (Versatile Light System) device combines multiple Vegas to create a more accurate scene that an automotive camera system would encounter in the real world. Automotive camera systems must be rigorously tested for these metrics to ensure high performance and safety of the vehicles, particularly ADAS vehicles.
*Disclaimer: The opinions contained within the IEEE-P2020 working group solely represent the views of this working group and do not necessarily represent the position of either the IEEE or the IEEE Standards Association.

Metrics derived from measuring dynamic range
Several metrics can be derived from measuring a camera's dynamic range, providing insights into its image quality performance. Some of these metrics include:
Signal-to-noise ratio (SNR)
SNR measures the level of the desired signal relative to the background noise. In the context of dynamic range, a higher SNR indicates better image quality, especially in low-light conditions.
Exposure performance
This metric represents the range of exposures over which a camera can capture acceptable images without significant loss of detail in shadows or highlights.
Tone Mapping
Tone mapping is a process that maps a high dynamic range image to a range displayable on standard devices. The effectiveness of tone mapping algorithms is often evaluated alongside dynamic range measurements. However, modern display technology results in devices with a very high peak brightness and can show high dynamic range images, which, therefore, require less aggressive tone mapping.
Evaluating test results
After collecting the images, we recommend using analysis software such as the iQ-Analyzer-X to evaluate your test results. This software, built entirely on C++, is one of the market's most advanced image quality analysis software. It offers a high-speed analysis and is compatible with many of our test charts, including those discussed above. Load your captured test images in the software and learn where improvements can be made. In the case of dynamic range, the software will indicate which patches the camera struggled to identify.
A free version of the software is available for download on our website so that you can get started today with your dynamic range measurements.

Conclusion
Dynamic range is a critical parameter in assessing the image quality of camera systems across various industries. From mobile phones to automotive cameras, capturing a wide range of brightness levels is essential for delivering high-quality images in diverse conditions, even simulating a broad temperature range. Understanding and measuring dynamic range using tools like grayscale test charts, uniform light boxes, and advanced evaluation software allows manufacturers and engineers to optimize camera performance and meet the demands of different applications. As camera technology continues evolving and becoming more safety-driven (e.g., ADAS vehicles), the dynamic range will remain a key focus in the drive to better image quality.

