Resolution
Image Quality FactorsIntroduction
Image resolution is the ability of a digital camera to reproduce the details of a scene. Resolution is an essential image quality attribute as it relates to the overall image quality perceived by a human observer. Various factors influence image resolution including the lens quality, alignment of the components, ideal focusing, exposure time, a sensor with optical components in front of it (low pass filter, IR filter, etc.), and aperture. All of these components are responsible for reproducing the details of objects within a scene (Figure 1).


When does insufficient resolution occur?
During the first years of digital photography, it was usually the sensor with its limited number of pixels that was the obstacle for image resolution. For this reason, the number of pixels is often wrongly referred to as resolution. With an increasing number of pixels, the barrier has shifted over the last few years to factors like optical performance, autofocus, and motion blur. Today's pixel size limits are frequently pushed to the point that the optical phenomenon diffraction is now a point of consideration.
Today, high resolution relies on a high-quality lens to produce fine detail, especially image quality in the image corner. As an image expands from the center to the corner, the resolution will often worsen due to various optical factors such as spherical and chromatic aberrations.
Methods for measuring resolution
The measurement of resolution is a measurement of the spatial frequency response (SFR*). This function describes how well the system under test can reproduce a range of spatial frequencies (Figure 2) on a scale from 0% (complete loss of information) to 100% (perfect reproduction without data loss).
When measuring a camera system's resolution, we recommend beginning with the SFR measurement using the ISO 12233 standard1. After obtaining the SFR, many different metrics can be derived from it.
The standard describes three methods to measure resolution. However, only two of them lead to an SFR. The main difference between the methods is the test patterns. For example, the e-SFR uses slanted edges, and s-SFR uses a sinusoidal Siemens star.
The third method to obtain an SFR is the dead leaves approach. This approach is highly optimized for a texture loss analysis. Details can be found in the section about texture loss.
The term SFR is currently recommended when describing resolution measurements, even though the term MTF (modulation transfer function) is still very common. An MTF is an SFR, but not all SFR’s are an MTF. Per definition, an SFR is only an MTF if modulation is involved and the modulation uses harmonic functions. Essentially, the s-SFR method could be seen as SFR and MTF, while the e-SFR is “only” an SFR.
E-SFR / Slanted Edges
The slanted edge analysis'sfundamental idea goes back to scanner evaluation before digital cameras were widely available. The system under test had to be able to reproduce a slanted edge test target.
The main idea of an e-SFR measurement is shown in three steps:
1.) Obtain the edge spread function
The edge spread function (ESF) describes how the system under test reproduces an edge. In other words, it shows the transition from the low-intensity to the high-intensity part of an edge in the image. The algorithms presented in ISO 12233 allow a super-resolution ESF, meaning the ESF has a four times higher sampling rate than the original image. Oversampling can define the edge transition when using all of the pixels along the target edge. However, only with a slanted edge will we find pixels from any distance in the region of interest to the center of the edge instead of the fixed amount of distances found in a single line or row.
2.) Obtain the line spread function
The line spread function (LSF) is simply the first derivative of the ESF. In some traditional lens test stations, the LSF is directly obtained without first knowing the ESF by reproducing a slit. While the procedure has some construction benefits, it is not as flexible as the slanted edge approach.
3.) Obtain the spatial frequency response
The SFR is finally calculated as the Fourier transformation of the LSF. A Fourier transformation converts a signal from the time/spatial domain into the frequency domain. Meaning that the signal is no longer described by “intensity vs. position” but by showing the combination of various spatial frequencies that the signal requires.
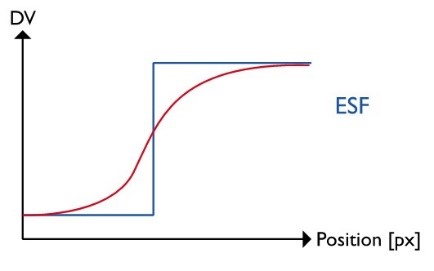
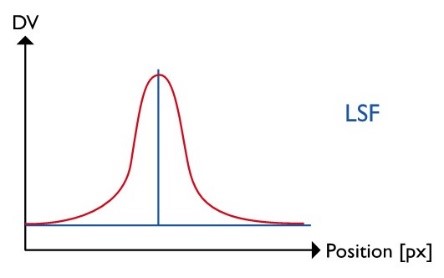
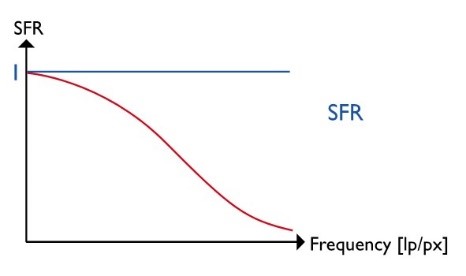
Figure 4: The three key steps for an e-SFR analysis, showing an ideal theoretical signal and a realistic camera signal
s-SFR / Siemens Star2
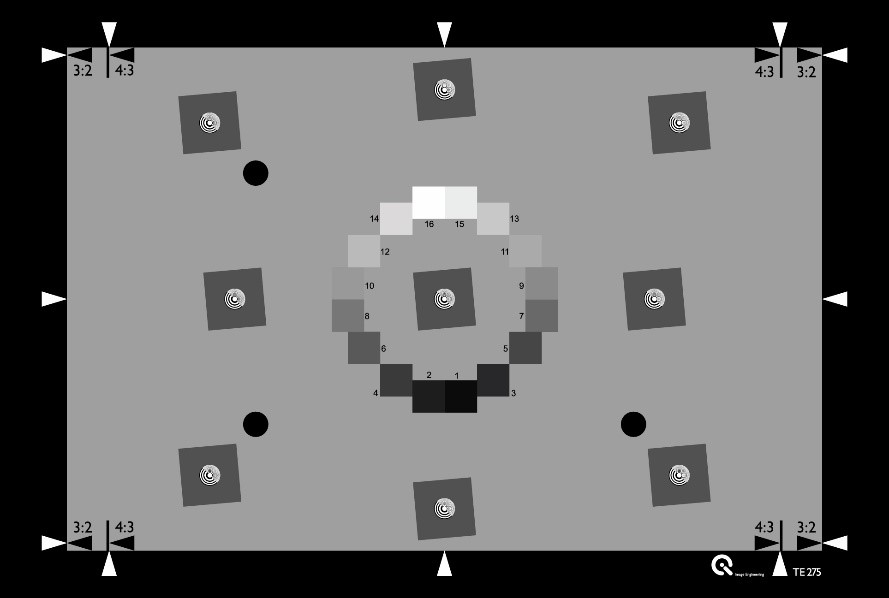
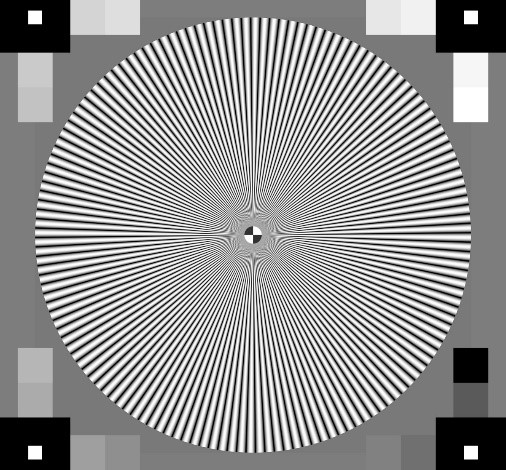
While the slanted edge method has been a part of ISO 12233 since the first version, the revision in 2014 has since added the s-SFR method. Although a recent addition to the standard, this method had already been in practical use for over ten years by our test lab and many customers had come to rely on it. The best test target for this procedure is a sinusoidal Siemens star (Figure 5). So, while it is true that a Siemens star is based on rectangular functions with increasing spatial frequency and decreasing radius, the sinusoidal Siemens star also utilizes harmonic functions.
The central concept is built because a harmonic function processed by a linear system will only be modified in modulation and/or phase but will remain harmonic. The modulation of a harmonic function is calculated as shown below and expresses the contrast it creates. A range of spatial frequencies needsto measure the modulation ratio in the target to the modulation in the image. This ratio is the modulation transfer function (MTF) of the system under test.
The system under test will reproduce the harmonic Siemens star while the control software locates the center of the star. For one given radius, the digital values per angle are measured, and a harmonic single MTF value. As the radius is directly representing the spatial frequency, we perform this measurement for all available radii. We can then plot the measured MTF for an extensive range of spatial frequencies.
What are the metrics derived from an SFR?
The measured SFR provides a lot of information. When establishing different metrics, the data can be reduced into a single number.
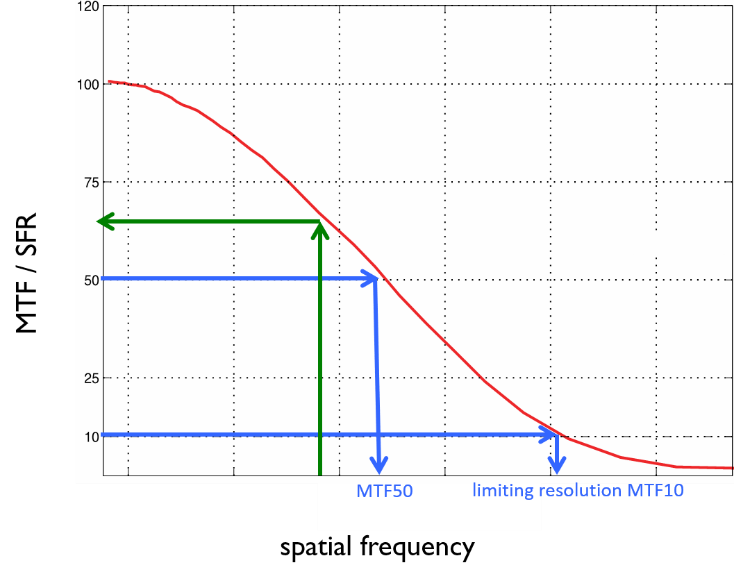
The limiting resolution is also known as MTF10, or the spatial frequency that leads to an SFR of 10%. The 10% limit has been determined based on the “Raleigh criterion,” which describes the limit of resolution based on the diffraction pattern of two points.
The MTF10 value describes the absolute maximum of details that you can find in an image in practice. These details are shown with low contrast but are still visible.
As the limiting resolution represents the maximum performance, this does not correlate with the subjective impression of sharpness. For a long time, the assumption was that the MTF50 value would be a better description of an image's sharpness. MTF50, however, is the spatial frequency that leads to an SFR of 50%. There is a correlation between subjective sharpness and MTF50, but new metrics, also referred to as acutance, show a more thorough correlation.
The acutance is calculated based on the measured SFR and the contrast sensitivity function (CSF) of the human visual system. The CSF is a model of how a human observer perceives spatial frequencies. Thus, measured spatial frequencies from the image need to convert into a representation of spatial frequencies for a specific viewing condition. Other than MTF50, the acutance takes the human observer and the particular viewing condition into account.
Conclusion
Resolution is one of the fundamental elements of image quality. Inadequate resolution leads to more than low-quality images; it can also lead to dangerous situations, especially in security and automotive industries that often rely on high-resolution images and video for safety and effectiveness. It is thus vital to properly test and analyze the image resolution of the camera system under test.
Which method should you use?
The e-SFR approach is relatively simple and allows high flexibility in chart design. Another benefit is the complete SFR measurement that is done within a small area in the image. When using the e-SFR method, it is essential to remember that image enhancement algorithms positively influence signal processing. It is quite simple to detect edges and to enhance the contrast of these edges. Thus, e-SFR measurements are affected by certain factors such as sharpening. These factors will not be a problem if the RAW data of the camera is accessible.
The s-SFR approach is much more robust against sharpening and other image enhancement algorithms. It allows the measurement and assessment of a system's optical performance even when RAW data is unavailable. Other than e-SFR, the s-SFR is, in most cases, capable of providing reliable information within the high frequencies to obtain, for example, MTF10.
If no RAW data is available, it is most beneficial to measure different SFR on different structures. That way, we can get the optical performance from the s-SFR and information about sharpening (link) from the e-SFR.