Texture Loss
Image Quality FactorsIntroduction
The texture in digital imaging is often referred to as low contrast fine detail. For example, the individual blades of grass of a meadow or the leaves from a tree are the fine details or texture. The camera should be capable of reproducing these details. In this context, the technical terms are high spatial frequencies that often combine with low local contrast and color differences. For the camera, it is challenging to differentiate texture from the camera's unwanted noise at higher ISO sensitivity settings in situations with low light levels. So, a reduction of the noise level in an image often leads to texture loss.
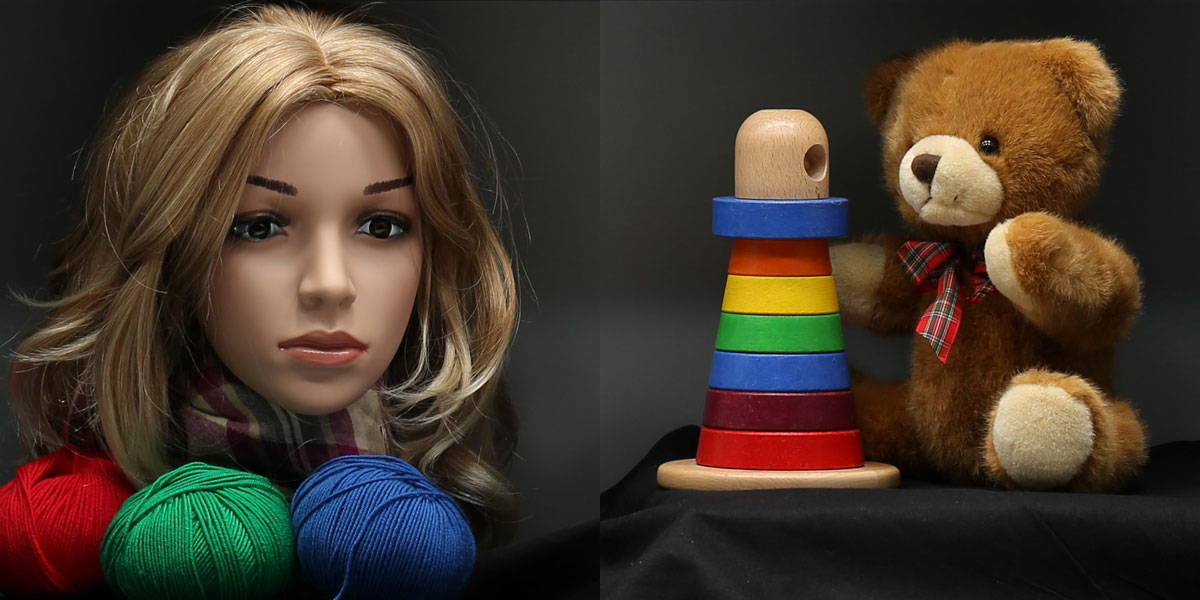
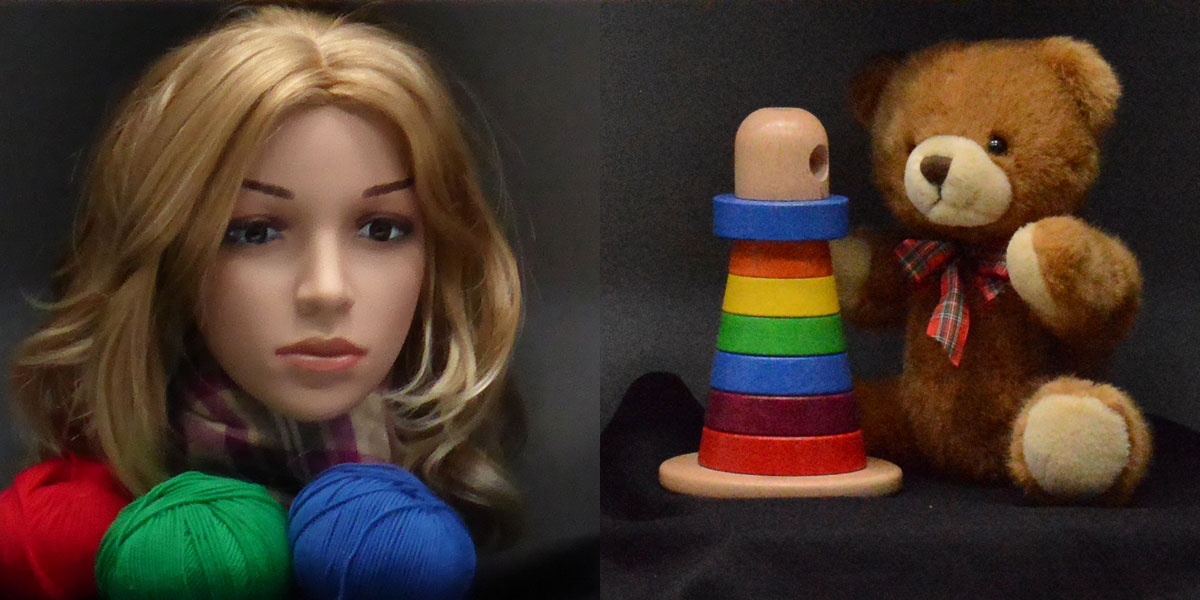
Simply stated, texture loss is the loss of fine details in an image due to a reduction of noise (Figure 1). With today’s advanced image processing, it has become easier to reduce unwanted noise and other artifacts. However, this process can also diminish important texture leading to poor image quality.
Of course, the recommendation is to find the right balance between noise reduction and texture loss. To do this, noise, as well as texture loss, must be measured and analyzed.
How to measure texture loss
A texture loss measurement is technically a resolution measurement that uses a different test target instead of the ones described in ISO 122331 (the leading resolution standard). During testing, the device under test will reproduce the test target, and the analysis software (e.g., iQ-Analyzer-X) will provide an SFR (spatial frequency response). This SFR describes how well the system can reproduce the texture in the image.
We define texture as low contrast and fine details; thus, our test target needs also to show low contrast and fine details. Two different test targets are available for testing a camera for its texture loss.
Low contrast Siemens star
The ISO 12233 standard describes the s-SFR method based on high contrast, sinusoidal Siemens star (Figure 2). This method is robust against sharpening and a great tool to obtain a reliable measurement of the limiting resolution2.
Meanwhile, ISO 195673 explicitly addresses texture loss measurements. This standard is based on the s-SFR method but uses a low contrast version of the Siemens star (Figure 2).
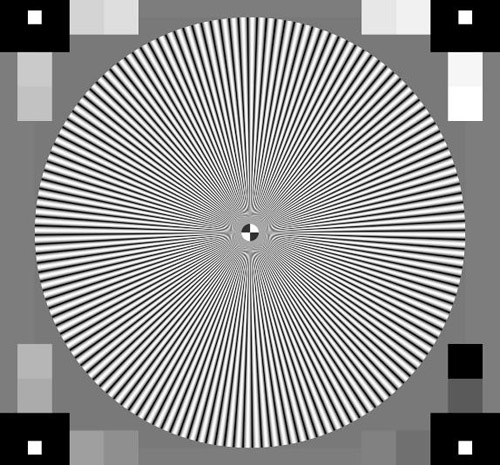
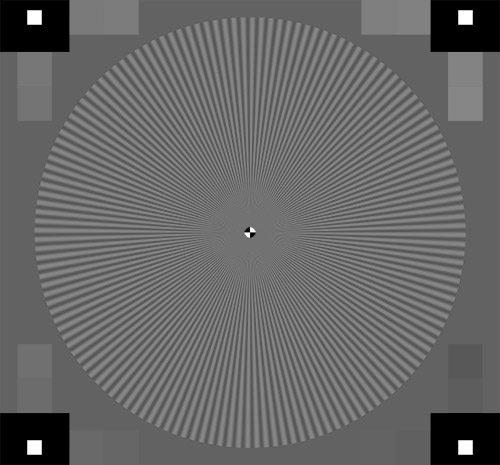
In short, the analysis software will detect the center of the Siemens star and then read out digital values along a radius from the image. Use these values to calculate the modulation, which will result in an SFR if done for all radii and angles. So, the SFR calculation is entirely based on an analysis of the digital values if we stay within the spatial domain.
What is a dead leaves target?
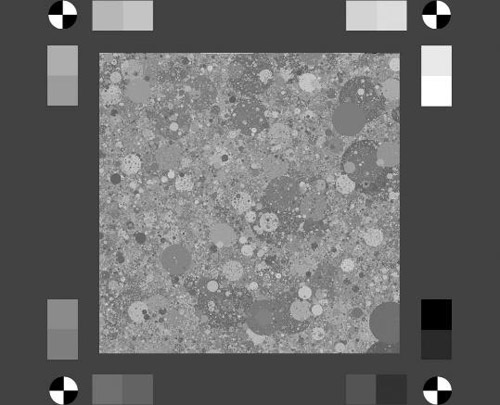
As opposed to the Siemens star chart, the dead leaves chart (Figure 3) creates a more natural testing scene or test structure for texture loss.
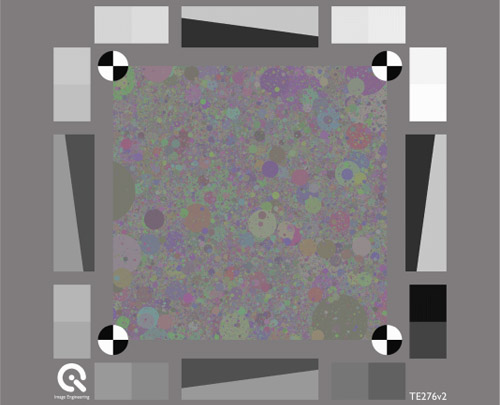
The chart itself was introduced as a model for natural images. Essentially, it is a large stack of circles with a known probability for their size and color. In its first appearance, the dead leaves target was still gray. However, the latest research4 used a color version (Figure 3), as that better represents a more natural scene and ultimately leads to a better correlation between measurement and user experience.
How to analyze texture loss using a dead leaves target
Over the years, different methods for analyzing an image showing the dead leaves pattern have been developed. The early ones were very much influenced by image noise and could be seen more like a "proof of concept" than a stable measurement.
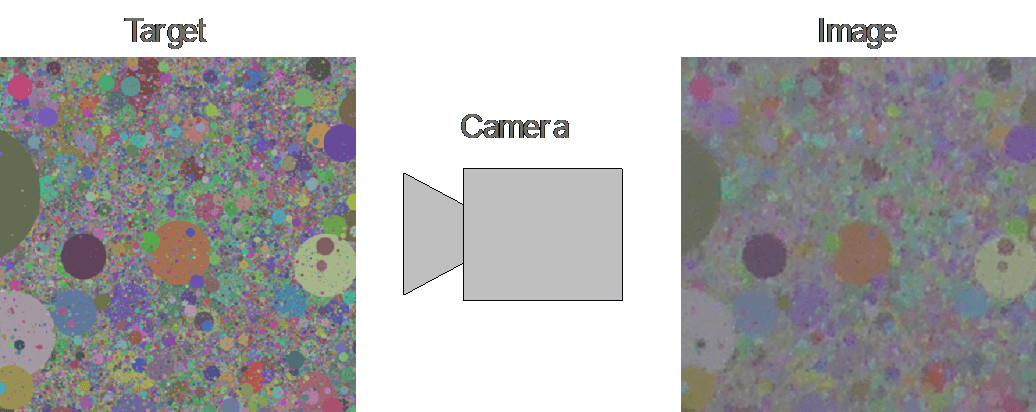
The dead leaves target also looks more natural than other test patterns. Another benefit is its power spectrum which is calculated from some simple properties during the creation process.
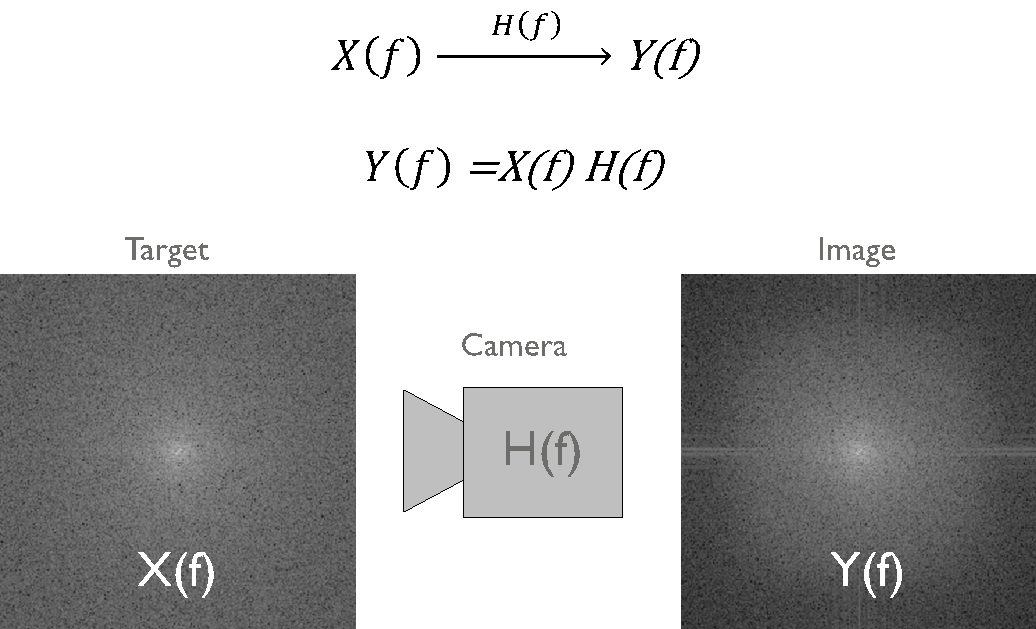
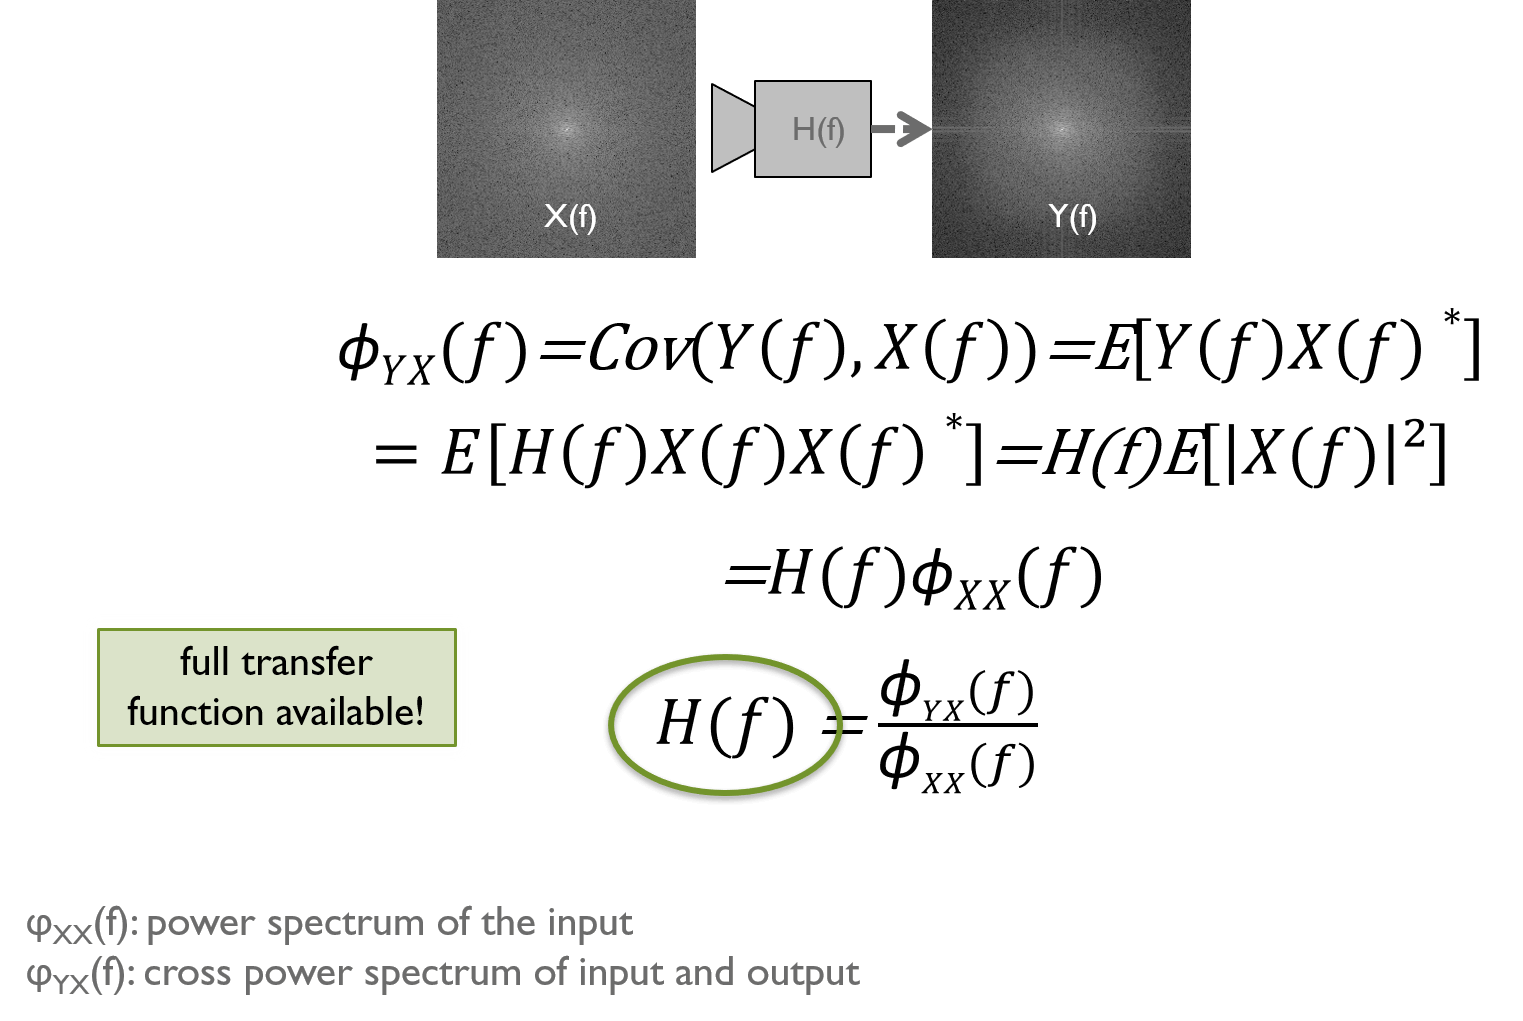
If we know the power spectrum of the target Y(f) and we measure the power spectrum in the image X(f), we can simply calculate the absolute of the transfer function H(f) as seen below (Figure 4).
Dead leaves direct method
With the work from John McElvain et al.5, a more robust and reliable analysis method is available5. As in the earlier approaches, it calculates the target's power spectrum and measures the power spectrum in the image. It also takes into account that the camera will not only remove spatial frequencies, but it will also add noise and thus high spatial frequencies as well. The dead leaves direct method adds the noise power spectrum measurement and uses it for a correction. The noise measurement requires an additional uniform gray area.
This approach is also used in the IEEE-P1858 CPIQ test procedure.
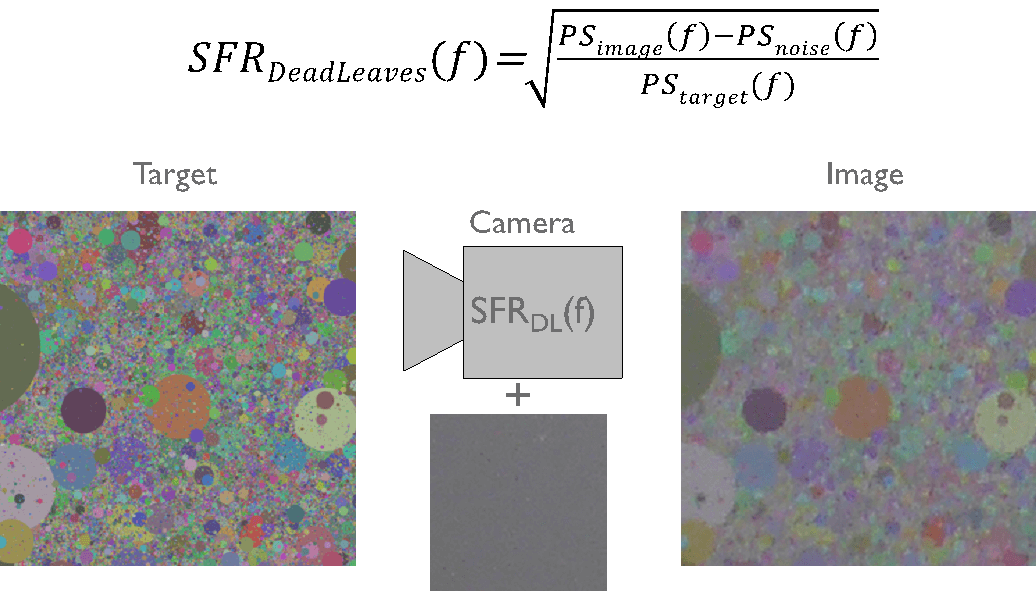
The dead leaves direct approach considers the noise that the camera will add to the image and affects the measurement of the power spectrum. While this approach is already much better than the earlier methods, it still encounters a few problems.
When we measure texture loss, we assume that the camera more or less performs a noise reduction. A modern noise reduction algorithm will function differently depending on the image content. In essence, we know that the noise reduction depends on the image content and that the noise added to the dead leaves structure by the camera is the same noise added to a uniform gray patch. However, this assumption is not valid in many cases, and we measure less noise on the gray patch than we find on the dead leaves structure.
Dead leaves cross method
A completely new approach was introduced in 2014. This method is called the dead leaves cross6 due to it using a cross-correlation between the image and the target data.
This method compares the image content with a reference image that needs to be explicitly calculated for the image captured based on the target's information, e.g., the distortion, shading, and tone curve. If this approach is applied, we can calculate the complete transfer function, including the phase information. Then we can calculate the SFR without the influence of image noise or other artifacts.
Conclusion
After we have performed the analysis, we will have an SFR. This SFR describes how well the device under test can reproduce the target. In other words, the lower the SFR, the more texture loss we have. As the lens and sensor will contribute to the SFR, we advise comparing the SFR obtained from the dead leaves to another robust method to measure the SFR. We recommend the s-SFR way, based on the high contrast Siemens star.
Test results and a comparison between the different methods are available on our website7. The test target used for these experiments is the TE42, analyzed by the iQ-Analyzer-X software.