Introduction
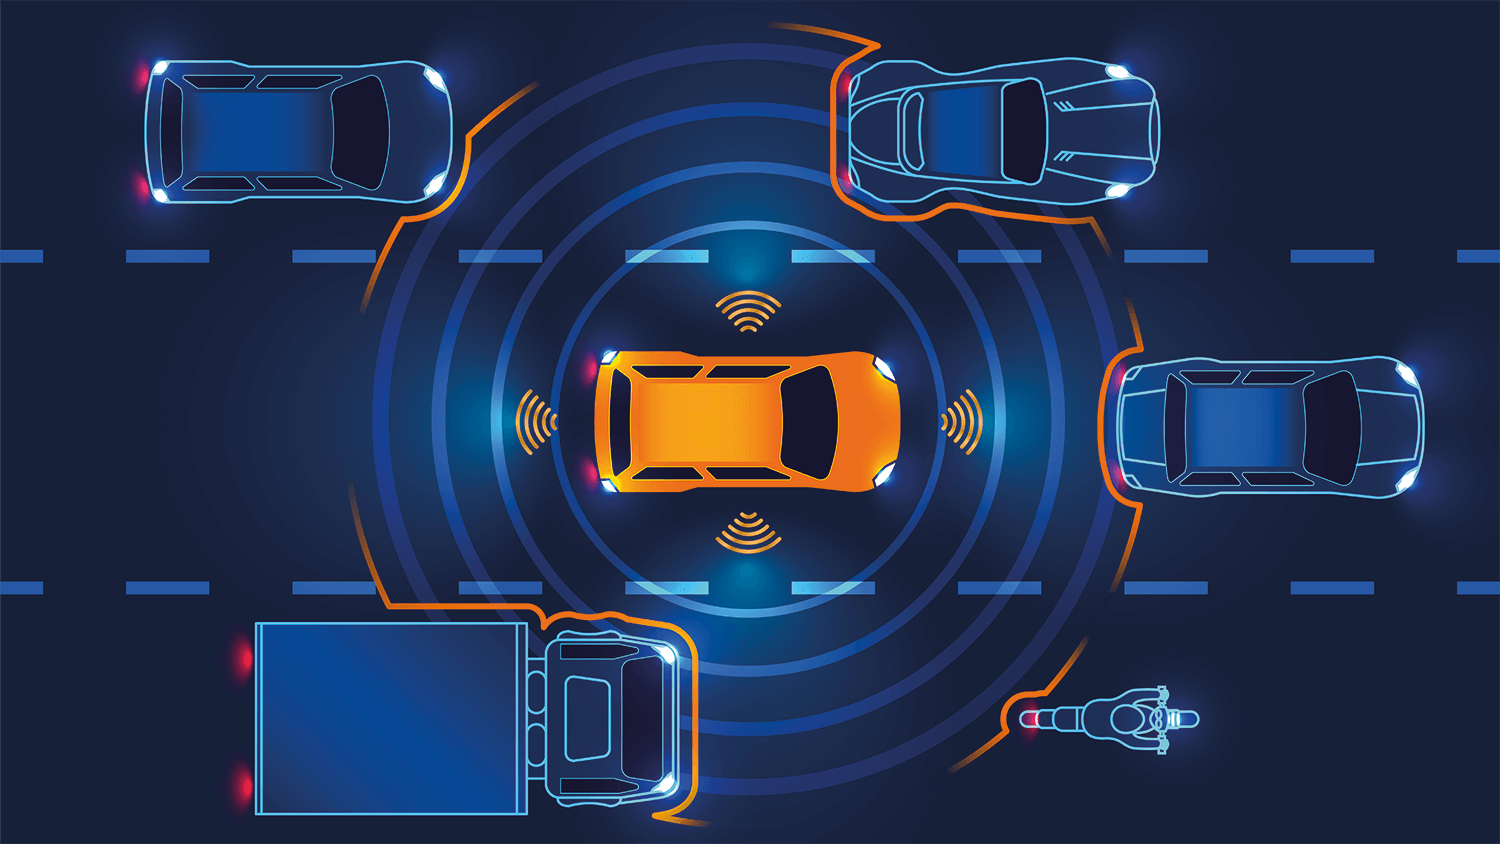
Almost every new car sold today has a camera/sensor monitoring system to assist with the numerous safety hazards that can occur at any given time while operating a vehicle. These systems provide the foundation for advanced driver assistance systems (ADAS) with the ultimate goal of eliminating the need for any human interaction while inside a moving vehicle. Achieving such a lofty goal will require collaboration across the automotive industry, and the IEEE-P2020 working group is taking the first steps to solve this challenge.
IEEE-P2020 is a group of automotive and camera system experts from across the industry. This group is developing an internationally recognized standard for ADAS and other automotive camera systems. Unlike most camera industries, automotive cameras are unique because they are directly involved in consumer safety. As such, these camera systems must perform at the highest level, at all times, and in any environmental condition. It is, therefore, imperative to create a standard that all companies abide by when developing ADAS systems.
The P2020 standard will contain a variety of performance metrics or image quality factors that will provide system manufacturers with an overview of what factors are crucial to test for ADAS systems. One such image quality factor is CDP/CTA or contrast detection probability (now known as contrast transfer accuracy). IEEE-P2020 defines CDP/CTA as the probability of accurately reproducing scene contrast within a specified area under a variety of imaging conditions.
As of now, the working group is in the process of conducting multiple validation tests using the CDP/CTA guidelines agreed upon by the group. The Image Quality Lab at Image Engineering is one of the labs administering these tests.
Validation Testing Method
Please note: The test processes and results described in this article are only intended as examples. Actual test processes and results may vary.
Since the beginning, test engineers from Image Engineering have been actively involved in the P2020 working group, and our iQ-Lab has a great understanding of the testing procedures and result metrics. In a recent round of testing, Image Engineering tested a series of cameras using the same testing conditions and equipment to compare the results better. It is also of note that the sensor configuration of each camera was provided by the manufacturer and remained unchanged by Image Engineering during testing.
Each camera underwent a series of CDP/CTA tests using the Dynamic Test Stand (DTS). This device uses six separate contrast detection boxes and 216 different intensities to analyze the camera system's ability to detect and differentiate multiple contrasts in its field of view.
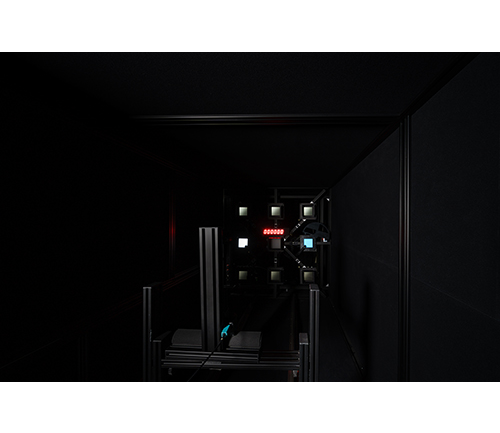
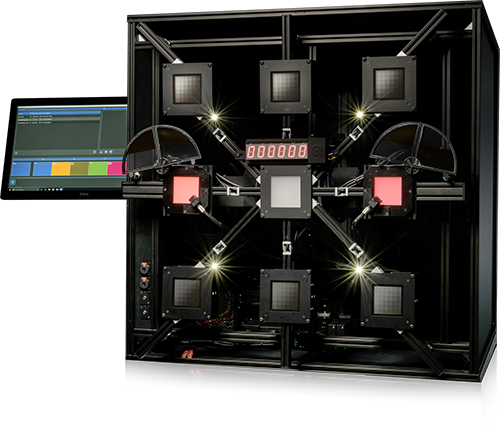
The DTS is calibrated with a high-quality luminance meter to ensure the luminance intensity can be accurately reached during testing. The luminance range is set to approximately [0.005; 50,000] cd/m², and the tests were performed in the DTS tunnel to eliminate stray light. Finally, the sensors were tested at room temperature. Image Engineering can, on request, test cameras at varying temperatures using the iQ-Climate Chamber.
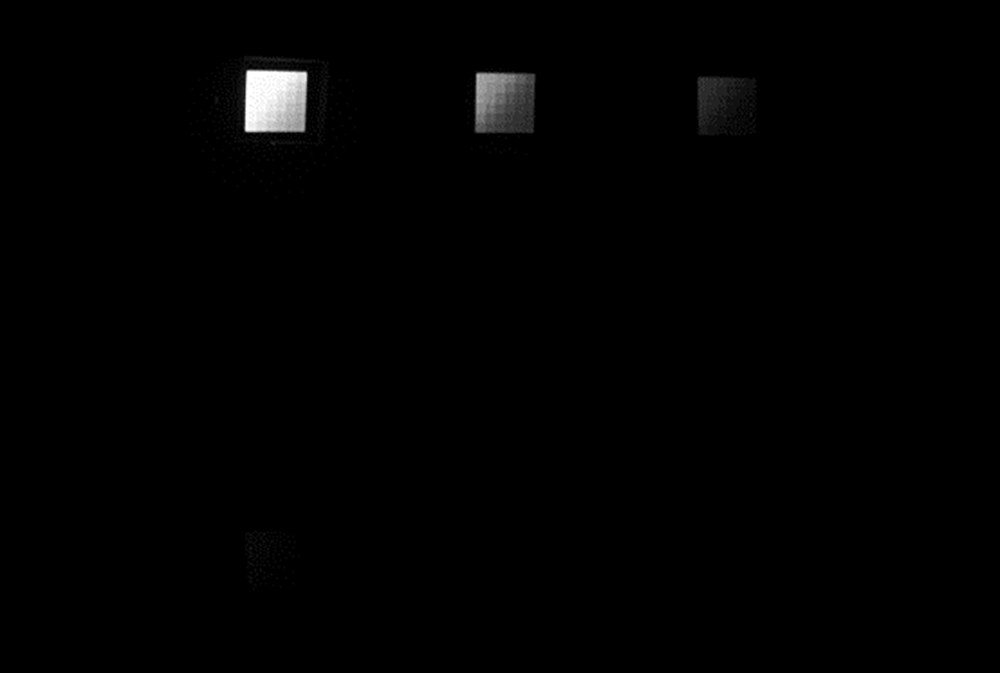
Figure 4 shows the DTS light boxes from the sensor's point of view. Each box has a different intensity, and every patch in every box is compared to the other patches to produce the results.
Test Results
During each test, randomly chosen pixels from one luminance are compared to randomly chosen pixels from another, resulting in a new distribution (power density function) and the basis for further calculations. This measurement process provides accurate test results that can better pinpoint the exact locations of underperforming quality.
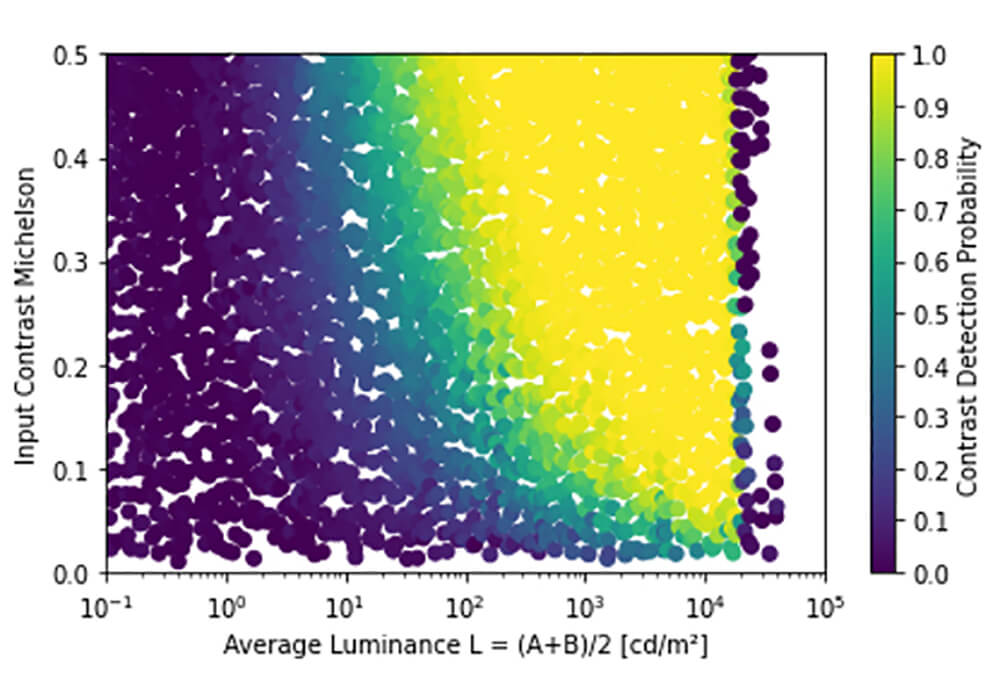
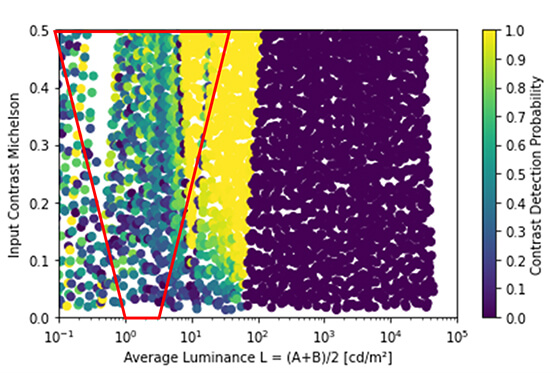
In general, the CDP/CTA results can be displayed using a graph (see figure 5). This graph shows various colors that indicate the probability of a contrast being reproduced in the camera's field of view. As we see in the graph above, the yellow patches indicate a strong reproduction performance in higher-intensity and contrast scenes. The performance drops to zero once saturation is reached, which is visible on the far-right side of the graph. Compare this to the purple patches that indicate poorer performance in low-light scenes.
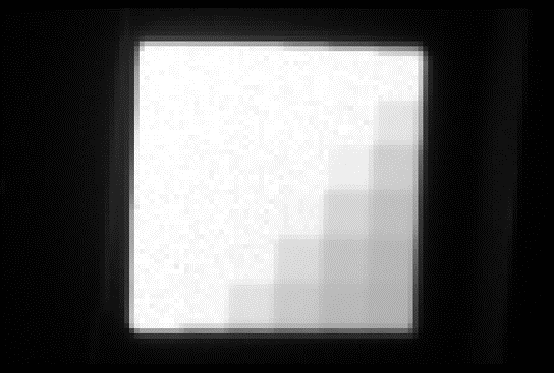
Looking at Figure 6 and the results in Figure 7 (see red cutout), we see that the camera performs well in higher illumination but still may experience issues (notice the noise in figure 7) when the intensity is exceptionally bright. Each image is analyzed section by section, and the respective patch is evaluated for plausibility and to check for potential testing errors.
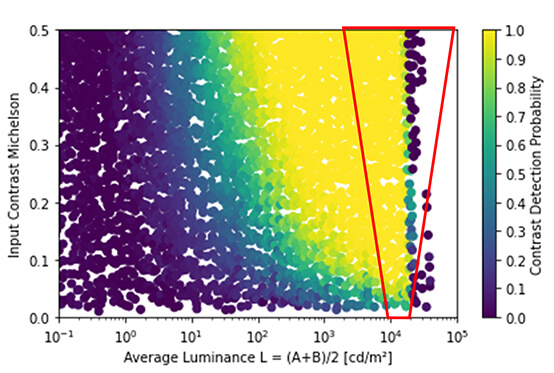
Figures 8 and 9 (see red cutout) show the results for mid-level intensity. Here we can see that denser patches show less probability of contrast detection when the light is lower.
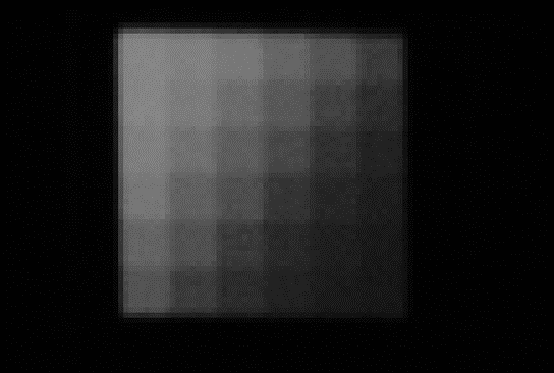
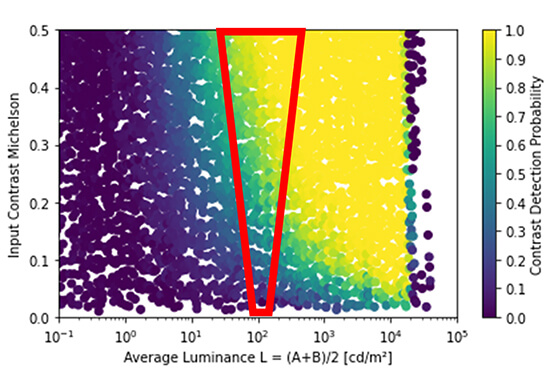
Finally, Figures 10 and 11 (see red outline) show us the effects on CDP/CTA when analyzing the camera's performance in a low-light situation.
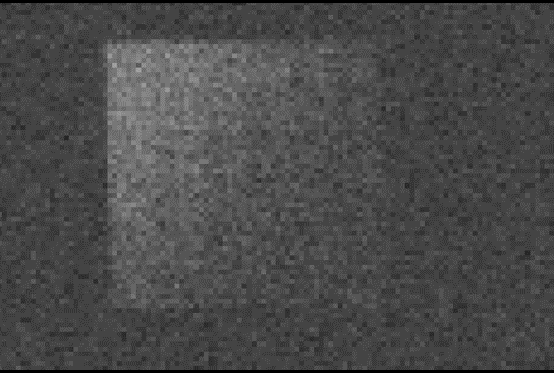
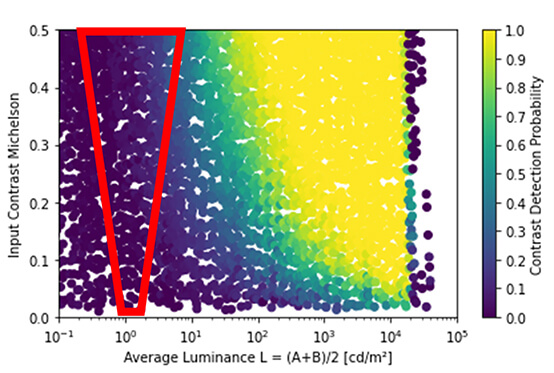
Altogether, the results above conclude that while the system performs adequately in bright light conditions, there is still room for improvement in other light conditions, especially low-light. These results are mostly expected as this is a low dynamic range, single-exposure image. The evaluation can be confirmed by looking at the corresponding patches.
Potential Measurement Errors
It is important to note that these results may depend on the camera/sensor settings. The settings for this particular system were left as when the manufacturer delivered it to us. Performing a CDP/CTA measurement could help the manufacturer optimize the performance of the camera/sensor.
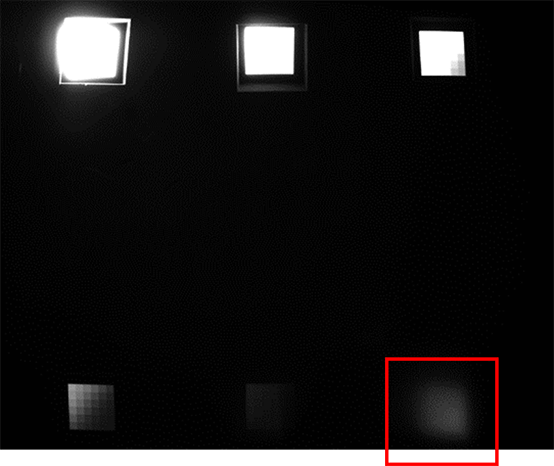
Another point to consider is the potential for flare disruption during the testing. If flare occurs during the test process, the entire test must be repeated at a different distance or alignment between the device under test and the DTS. Results with clear ghosting artifacts present in regions of interest are inaccurate. We identified an issue with flare during our tests, as seen in the results of figure 13.
Conclusion
As ADAS and other automotive camera systems become closer and closer to being fully autonomous, it has become imperative to establish international standards to ensure these systems' high performance and safety regardless of the operating environment. The IEEE-P2020 working group is currently in the process of developing such a standard for ADAS.
The P2020 standard will contain a variety of performance indicators that will provide system manufacturers with an overview of what factors are crucial to test for ADAS systems. One such factor is CDP/CTA or contrast detection probability (now known as contrast transfer accuracy). CDP/CTA refers to the probability of the camera/sensor system accurately reproducing an object's contrast in its field of view.
To help validate the standard, Image Engineering performed CDP/CTA tests on various devices that the group could then use for validation. The results clearly show the CDP/CTA performance of the cameras under test. The goal is to provide other test labs with the resources and tools to perform the CDP/CTA tests outlined in the P2020 standard. Once multiple labs have tested various devices for CDP/CTA, we will be one step closer to an official publication of the standard.
Want to learn more?
IEEE-P2020 is an open group, and we welcome any industry professional who would like to contribute to the standard's development. For more information on how to participate, please contact IEEE-P2020 directly.

