Introduction
Camera color characterization is an essential step in the color image processing pipeline. It evaluates how well the camera module translates RGB raw data from the sensor to the desired color space. Improper color calibration and characterization can lead to false-color reproduction, thereby hurting an image's overall image quality.
The traditional method for color characterization has always been to use a test chart such as a ColorChecker. However, as technology has advanced, so too have the solutions for color characterization. At Image Engineering, we have developed solutions that offer higher accuracy and characterize cameras in multiple situations, such as on a production line.
Download video (.mp4 160mb)The first step of camera color characterization is to measure the spectral sensitivity of the camera under test.
Obtain the spectral sensitivities
Without the spectral sensitivities, you cannot generate an ICC profile or color correction matrix, making it the most vital step for camera color characterization. After obtaining the spectral sensitivities, you can begin to characterize the color response of your camera module.
Method 1: Traditional test charts
The traditional method generates a color profile for the camera module under test by using a color chart. This chart needs to be captured under various lighting conditions. Unfortunately, the main disadvantage of using a test chart is the colors of, e.g., a ColorChecker are not identical to those you would encounter in the real world.
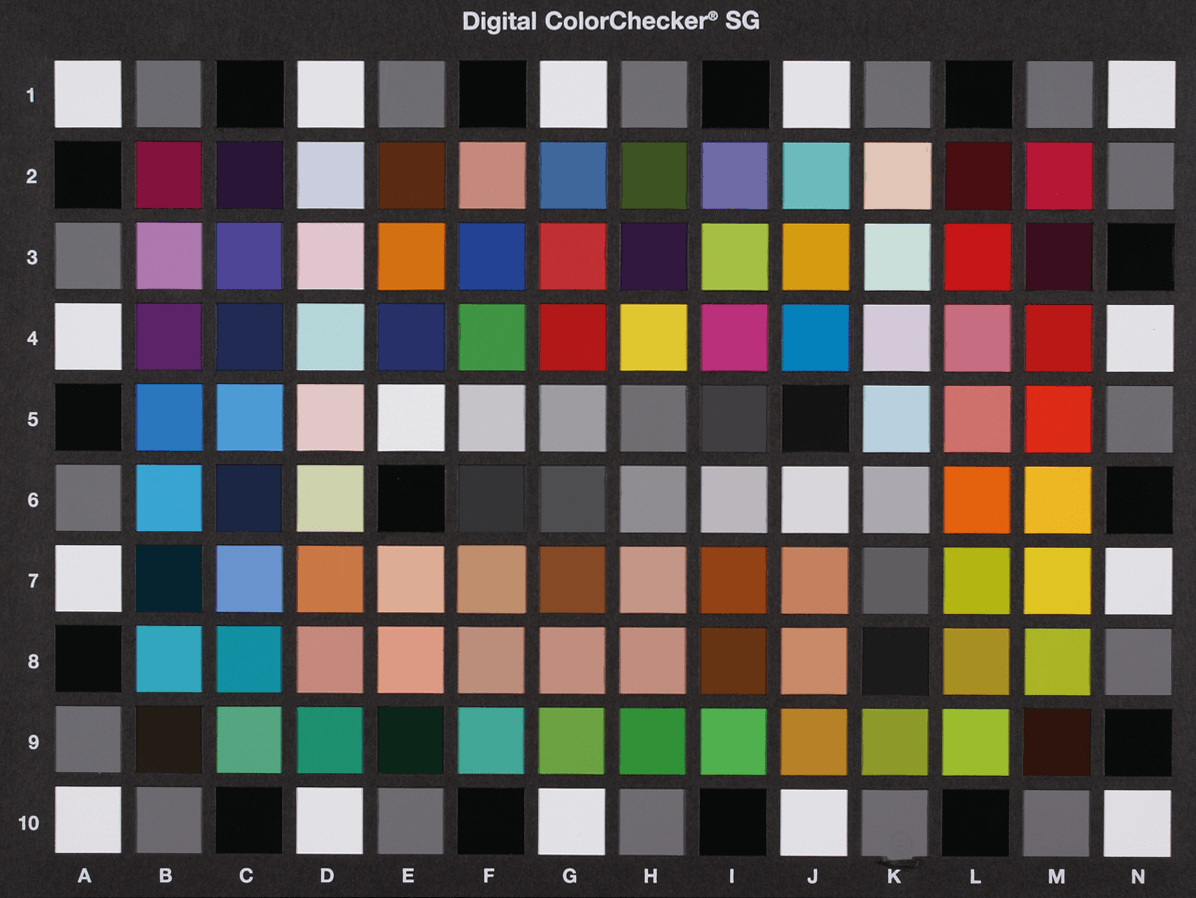
So, while test charts are still effective for color characterization, they are not as accurate as other methods because of their lack of real-world colors.
How to effectively utilize test charts?
Once you have obtained your color chart, you need to use a proper lab setup (i.e., a dark room with no stray light) with the correct illumination. To create a color profile, you will need to capture images of the chart under various lighting conditions. This process requires all the necessary sources such as Halogen or Fluorescent to be on hand to generate a profile or a color correction matrix for every requirement. If you are using test charts, we recommend using a spectrally tunable light source, such as the iQ-Flatlights, as they can generate all the essential spectra and allow automated spectra generation.
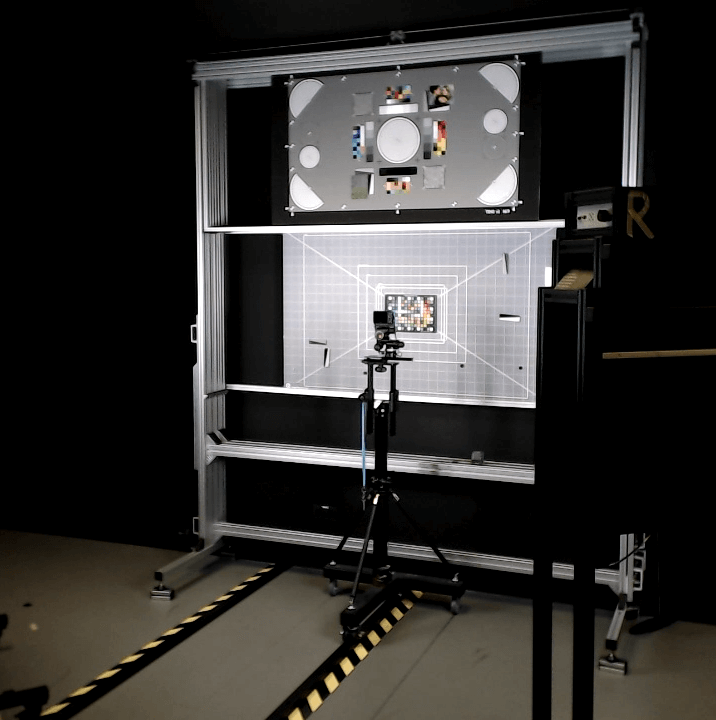
Method 2: A test chart using narrow-band interference filters
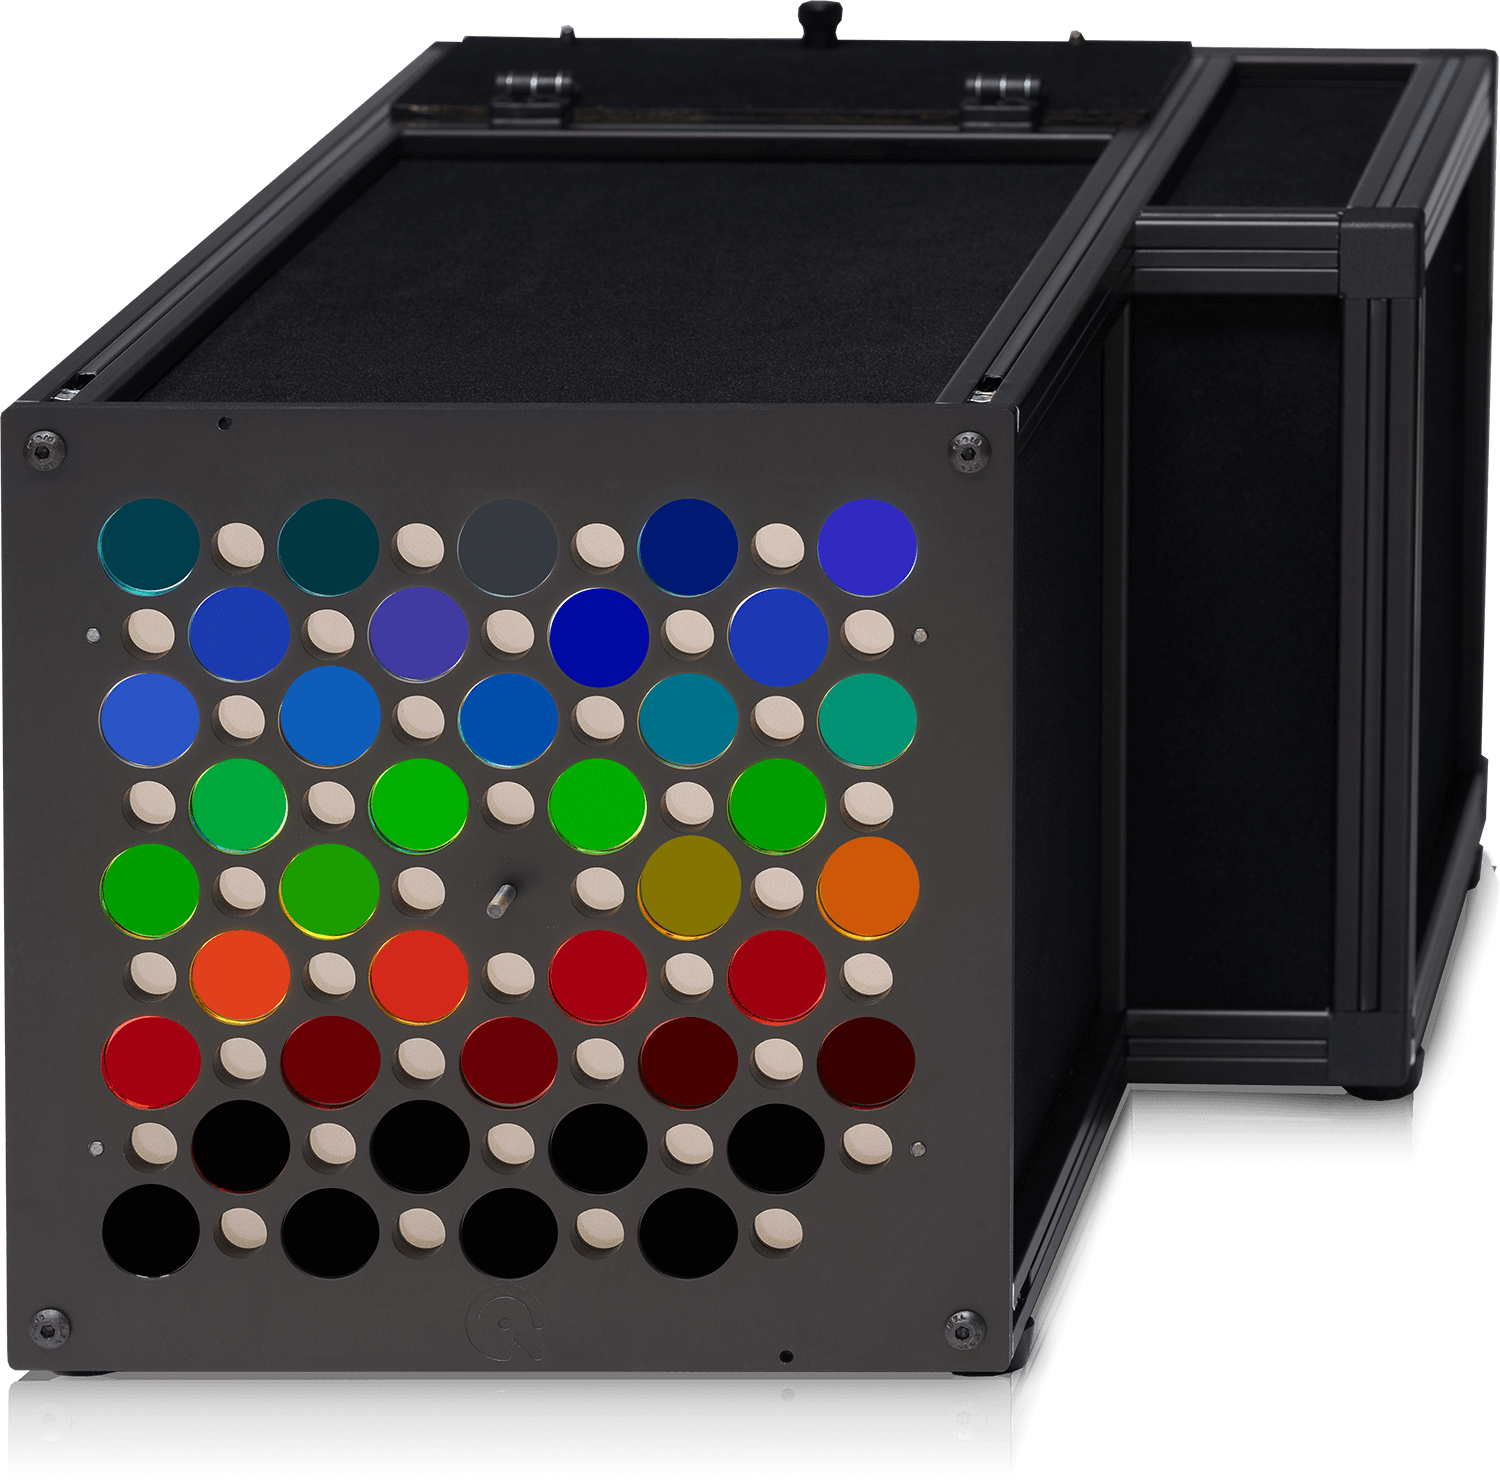
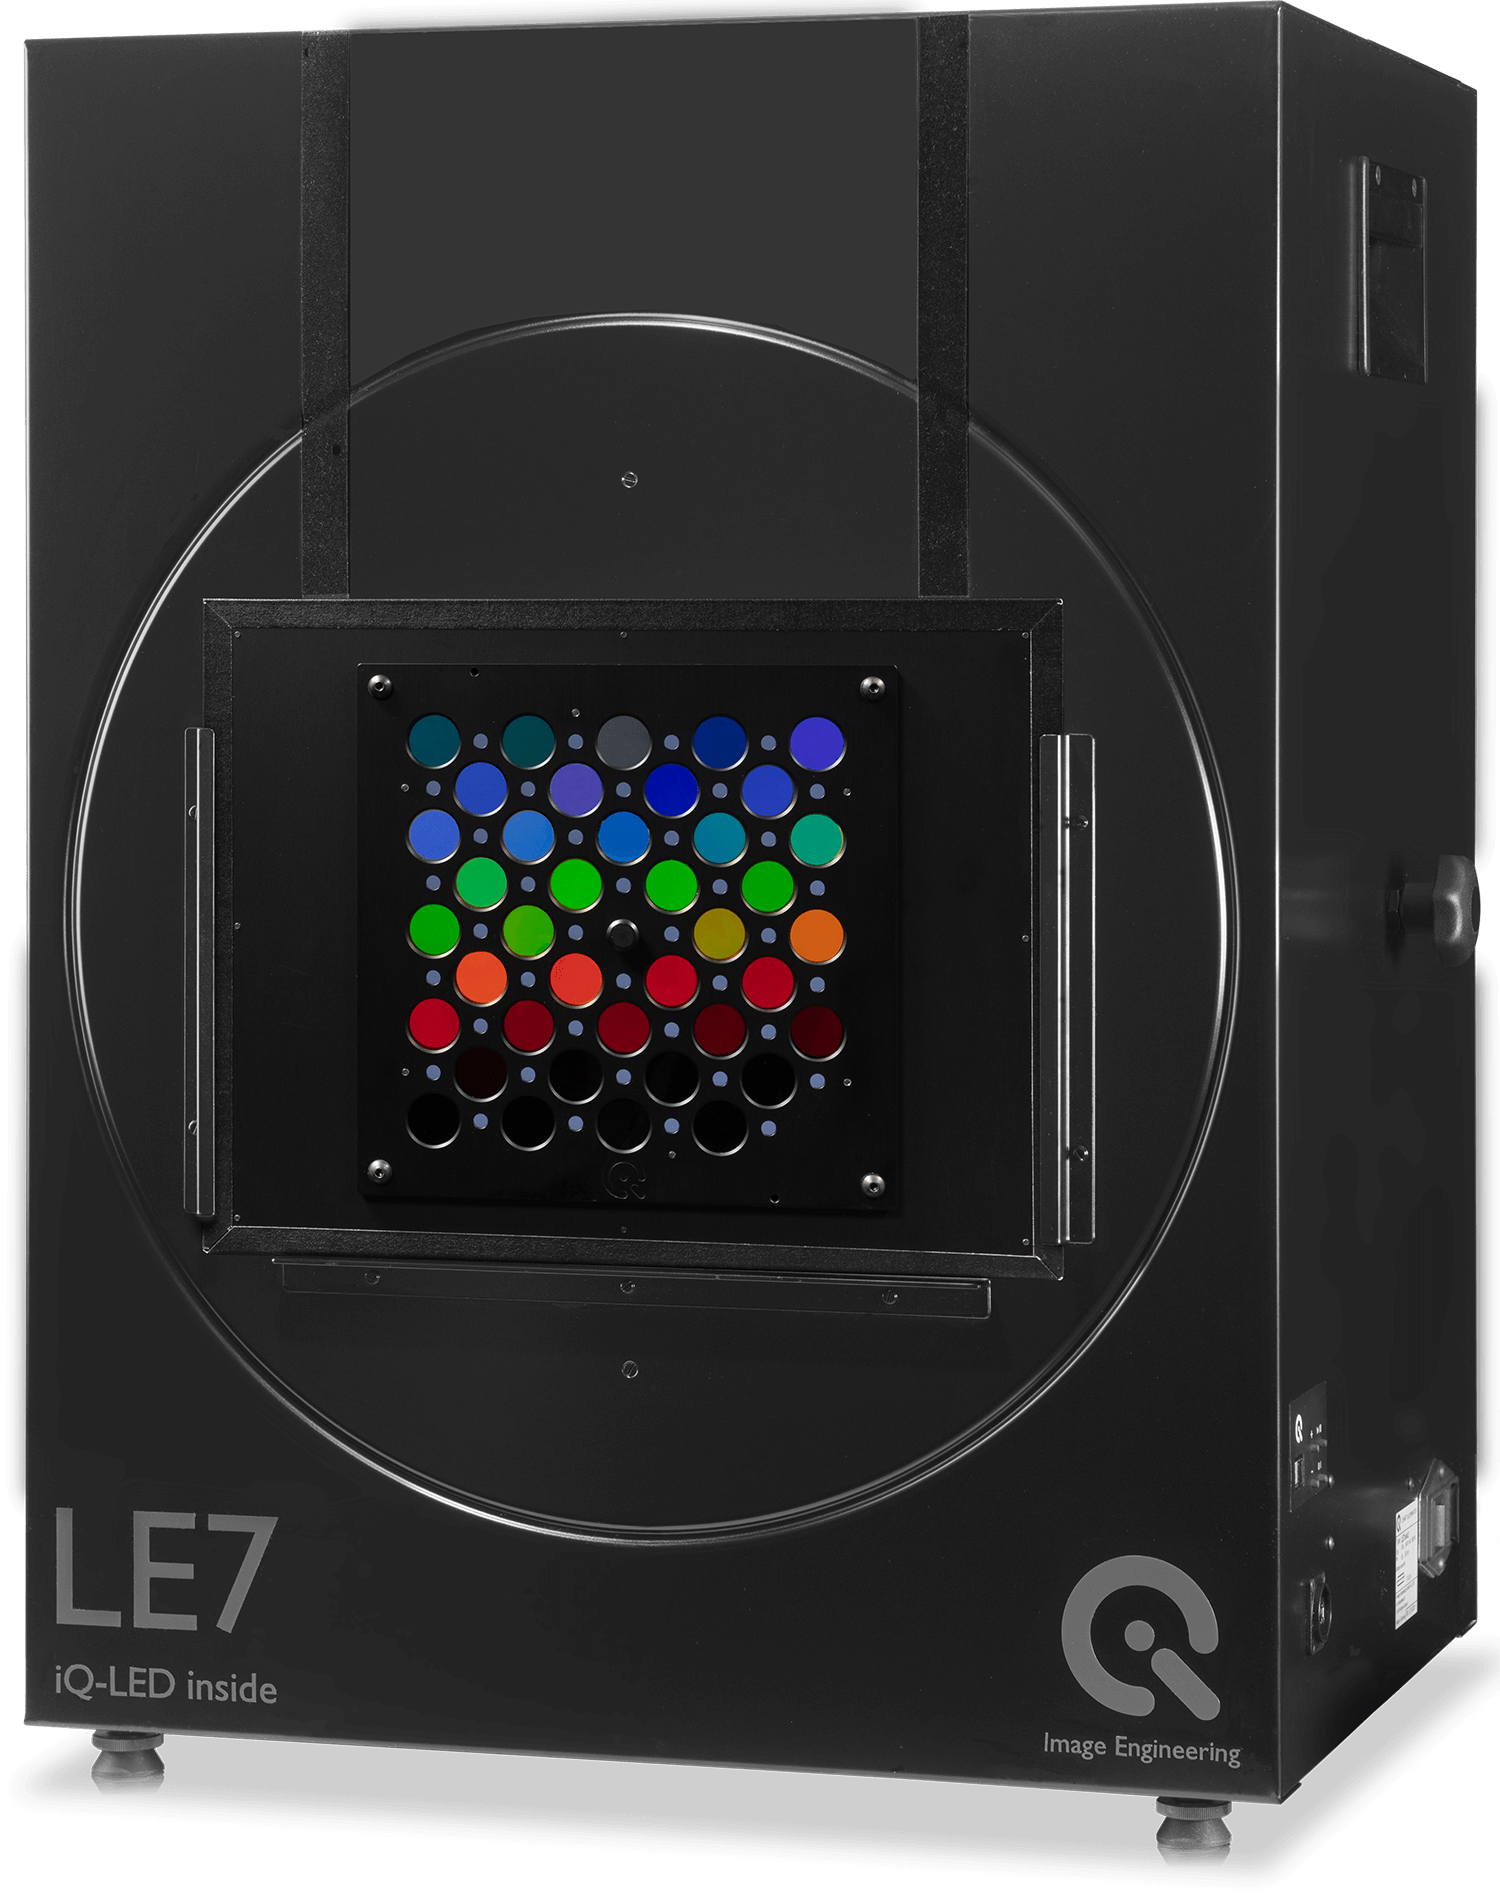
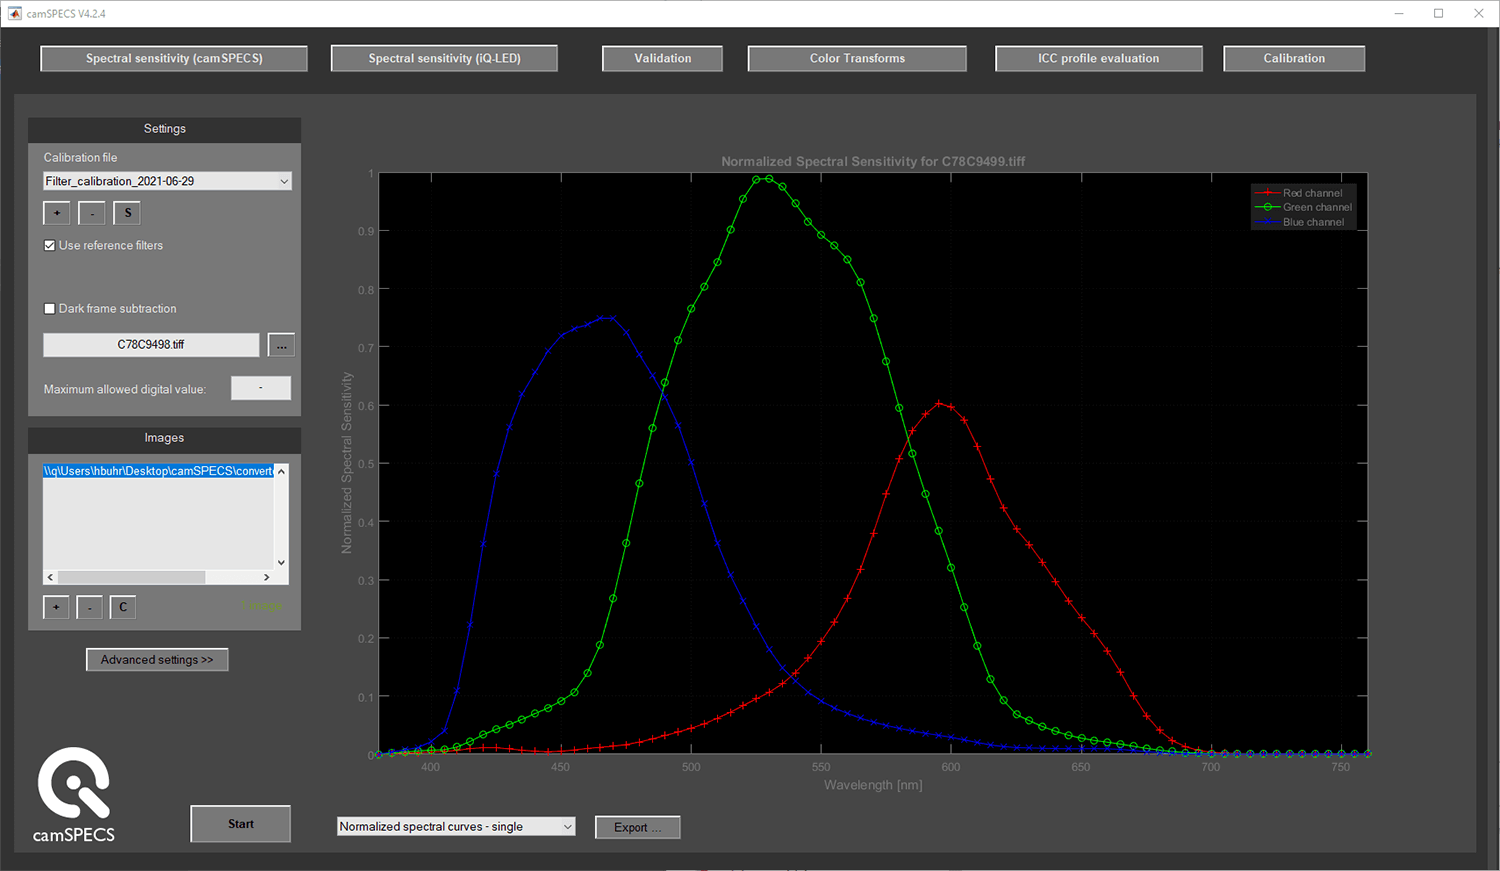
To improve color characterization, we have developed a test chart using narrow-band interference filters. These are better suited for measuring the spectral sensitivities of camera systems and are easier to handle than a monochromator. We incorporate this unique "test chart" throughout our camSPECS product line.
How to effectively utilize camSPECS?
Once a single image of the interference filter plate is captured, you can load it into the camSPECS software to automatically analyze and convert it. Once analyzed, the software will show you the spectral sensitivities of your camera. This method provides the basis for increased accuracy for camera color characterization.
Method 3: Using a spectrally tunable light source
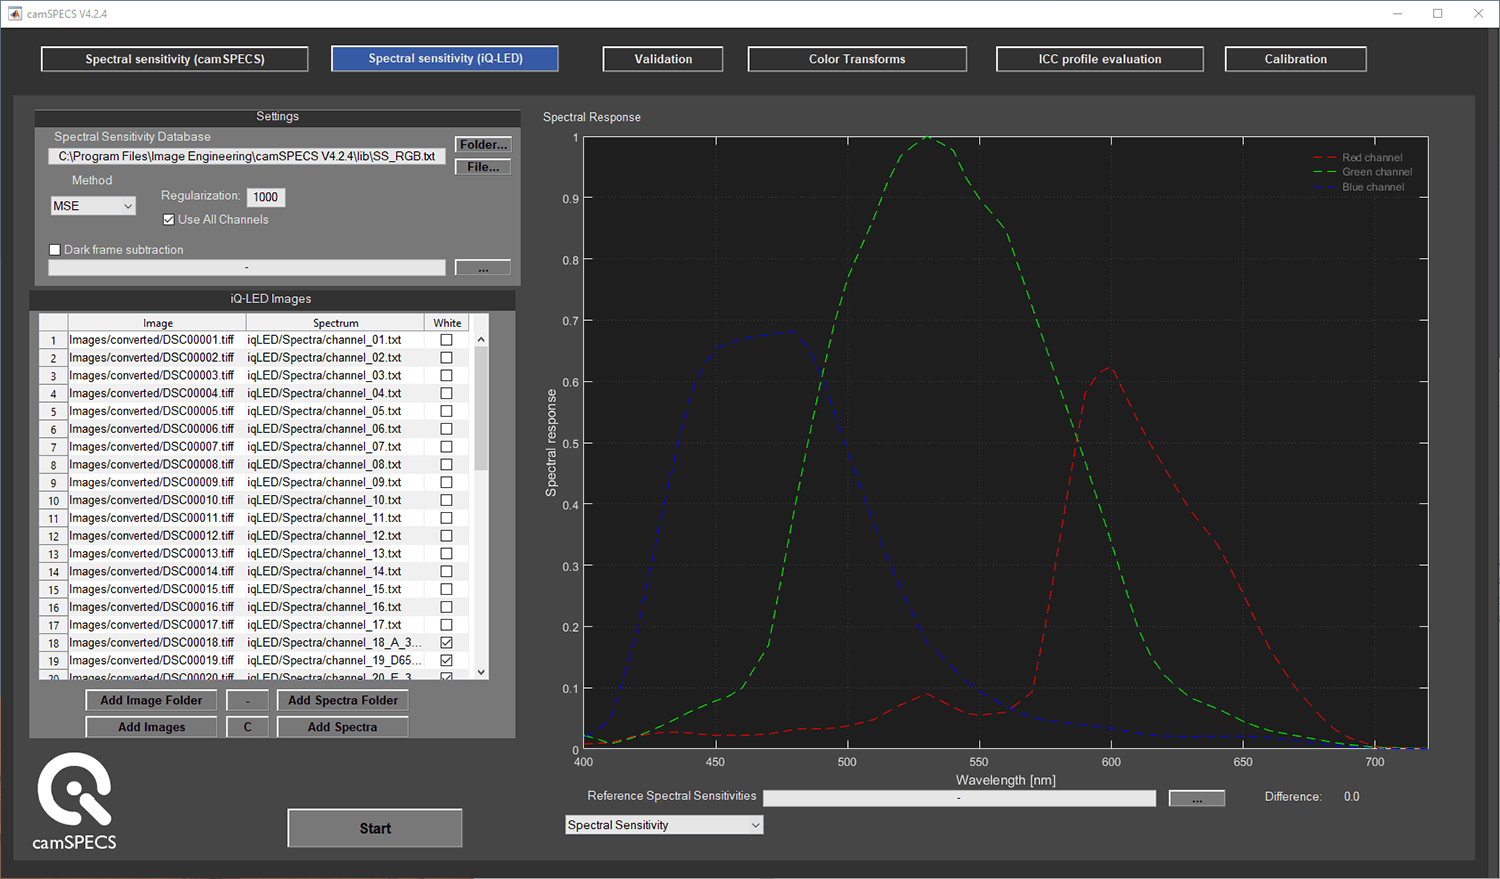
Our iQ-LED devices are very versatile, and we optimize them to measure a camera system's spectral sensitivity. As mentioned above, our iQ-LED devices are spectrally tunable and have 41 high-power SMD LEDs separated into 20 channels. When measuring spectral sensitivity, we capture an image of each illuminated channel.
The iQ-LED devices are unique because you can integrate them into a production line allowing you to perform multiple color calibrations at one time on the production line. For more information on the best practices for production line color calibration and characterization, please see this conference paper from Eric Walowit.
How to effectively utilize iQ-LED?
Images captured using an iQ-LED device can also be evaluated using the camSPECS software. Due to the limited number of iQ-LED channels, you need to use a spectral estimation method to get to the spectral sensitivities. Once that is complete, you can import all the images into the software. From there, you need to define the spectral distribution of each channel, which you can determine in the iQ-LED software, and then your spectral sensitivities are automatically calculated.
Generating a color correction transform
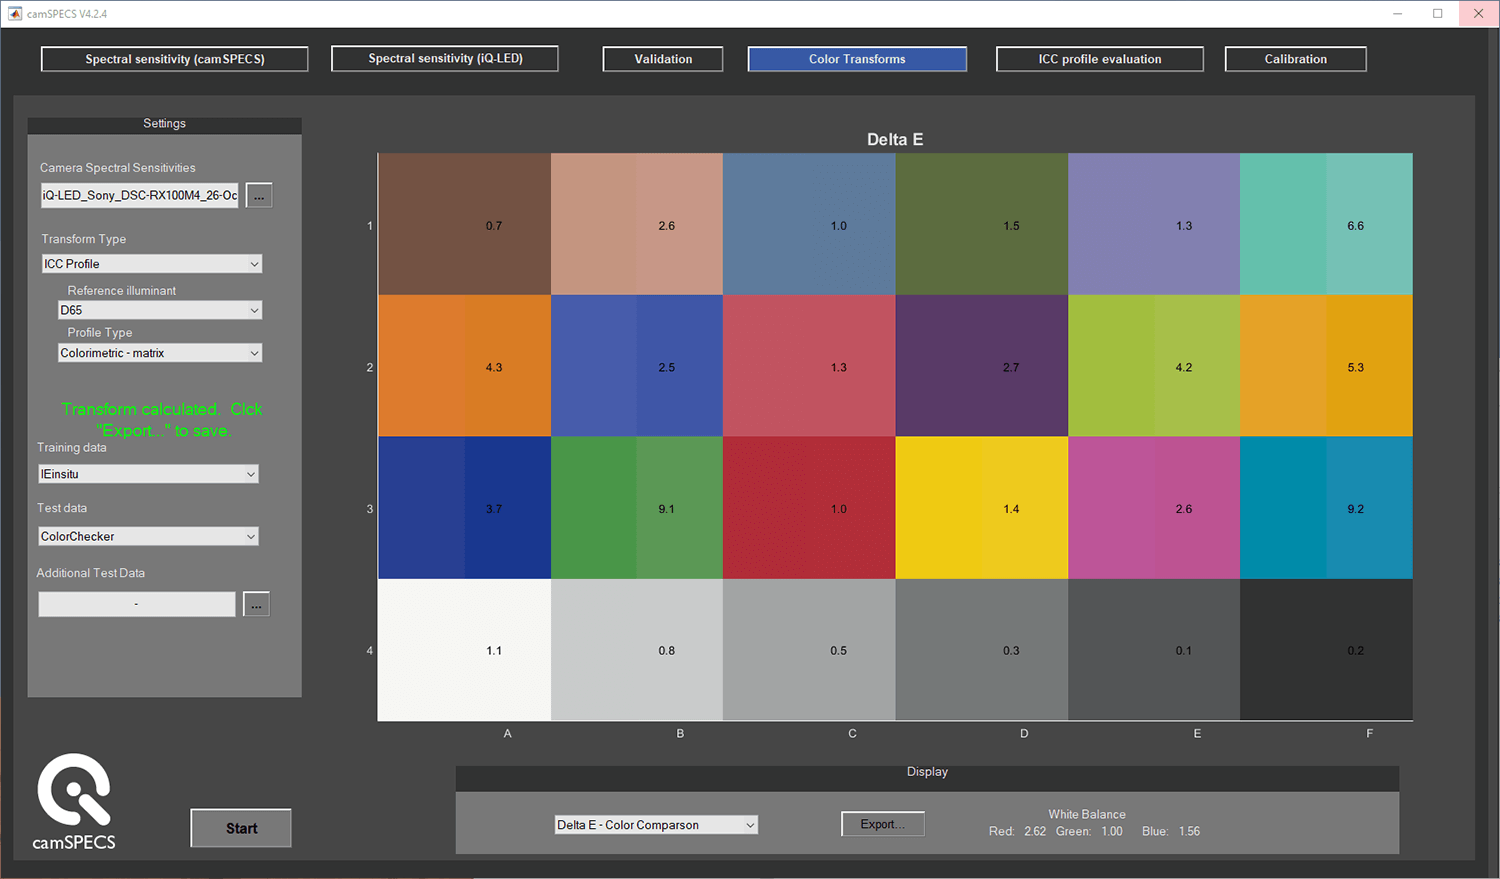
After determining your spectral sensitivities, you can now generate a color transform using the camSPECS software. Load your spectral sensitivities into the software and then choose the training and test data you would like to use. We recommend using in-situ real-world data instead of color chart data as it provides a much more accurate transformation for real-world scenes. Once everything is selected, the software will calculate the color transform, and it can be saved and stored as an ICC profile or a color correction matrix.
Verifying the quality of your color correction
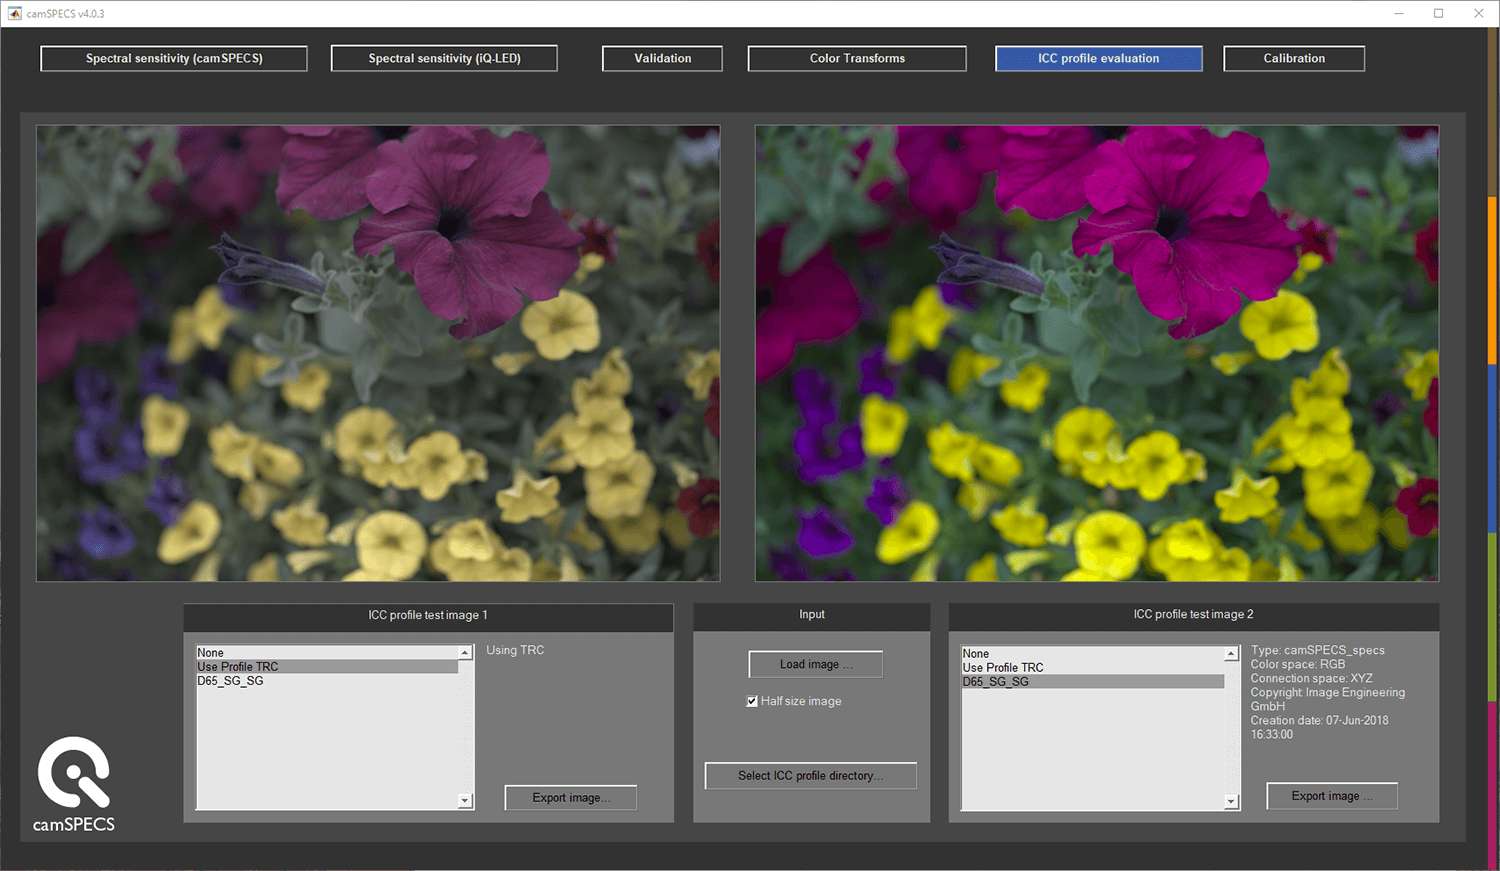
In the camSPECS software, you can verify the quality of your color correction by loading a RAW photo into the software. From there, you need to load the ICC profile or color correction matrix and then apply it to the RAW image. You can then visually see what happens to the color of your image.
Conclusion
Camera color characterization is one of the most crucial steps in the image processing pipeline. Without proper color characterization, your camera module may produce false colors in the processed image. There are multiple methods, from traditional color charts to spectrally tunable light sources, to measure the spectral sensitivity of your camera system. Once you have the spectral sensitivity, you can generate an ICC profile or color correction matrix and see how it affects your RAW images' color.
Want to learn more? Please don’t hesitate to contact our support team for more information and advice.

