The International Organization for Standardization published a revision of “ISO 12233 Photography — Electronic still picture imaging — Resolution and spatial frequency responses” in February 2014.
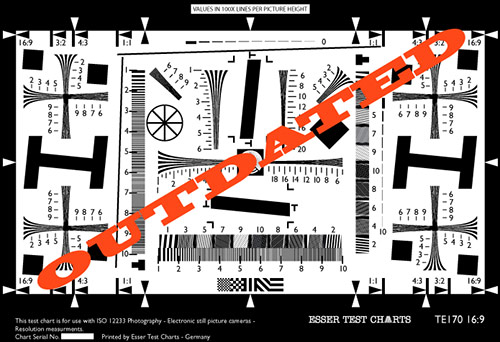
- It is defined as a high contrast test chart with a white background. This sometimes causes clipping in the highlights or/and the shadows.
- Visual analysis is often impossible.
- The high contrast edge is subject to sharpening which leads to misleading results when looking at an SFR derived from the edge. (see text below)
See image 1 for example. The difficulty, using visual analysis of the TE170. Where do you draw the line for limiting resolution?

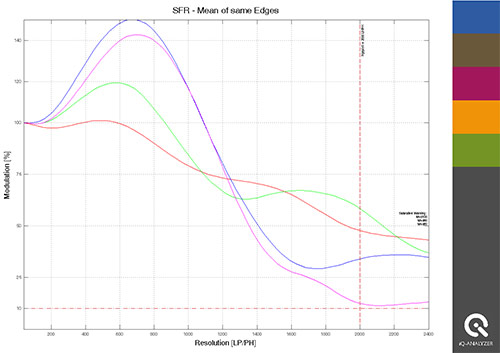
New test charts and methods in the revision
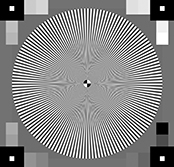
The new ISO12233 standard includes the sinusoidal Siemens star for resolution measurement. Image Engineering developed this method more than 10 years ago and has gained a lot of experience with it in this time. It is the best method for lens and camera evaluation as it is more robust compared to the slanted edge method.
The TE253 and TE268 have been in our portfolio for quite a while and make a very good companion to the iQ-Analyzer, the complete software solution.
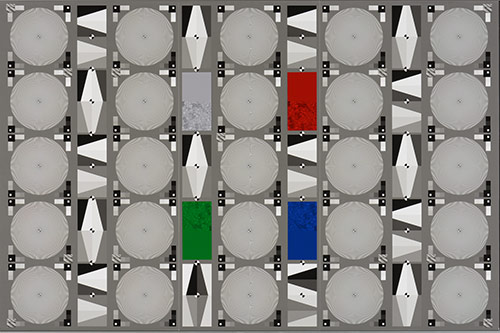
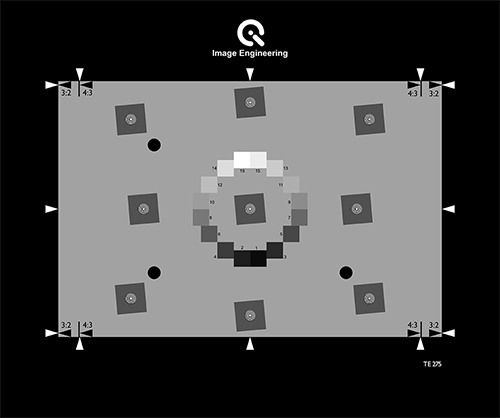
The TE275 has been added to follow the updated standard.
For further details, please look at our techNote on this topic.

