What is flare?
Image quality describes how well a digital camera system performs when reproducing the intended scene or object. Broadcasting cameras, like those of other industries, often experience deficiencies in image quality. These flaws range from low image resolution to poor color accuracy. The broadcasting industry has an expansive environment in which the cameras must consistently produce high image quality. One factor that is regularly affected while also being equally difficult to measure is lens flare.
Flare occurs due to reflections of light at every surface of the lens and camera. It affects image quality by creating a diffuse veil over the surface of the image and thus leading to a loss of contrast.
![A captured scene without the presence of image flare. image ohne flare](/content/news/2018/2018_08_30_flare_ibc/image_ohne_flare.jpg)
![A captured scene with the presence of image flare. The flare from the lens has created a diffuse veil over the surface of the image leading to a loss of image contrast. image mit flare](/content/news/2018/2018_08_30_flare_ibc/image_mit_flare.jpg)
Two separate ISO standards, ISO 9358 and ISO 18844, have been published in an attempt to provide a way to test and analyze flare in a lab setting accurately. ISO 18844, the more recent of the two, describes flare as an unwanted increase in signal within a processed image output. This signal increase is caused by light that does not emanate from the corresponding subject point. 18844 relies on test charts for an accurate analysis of flare.
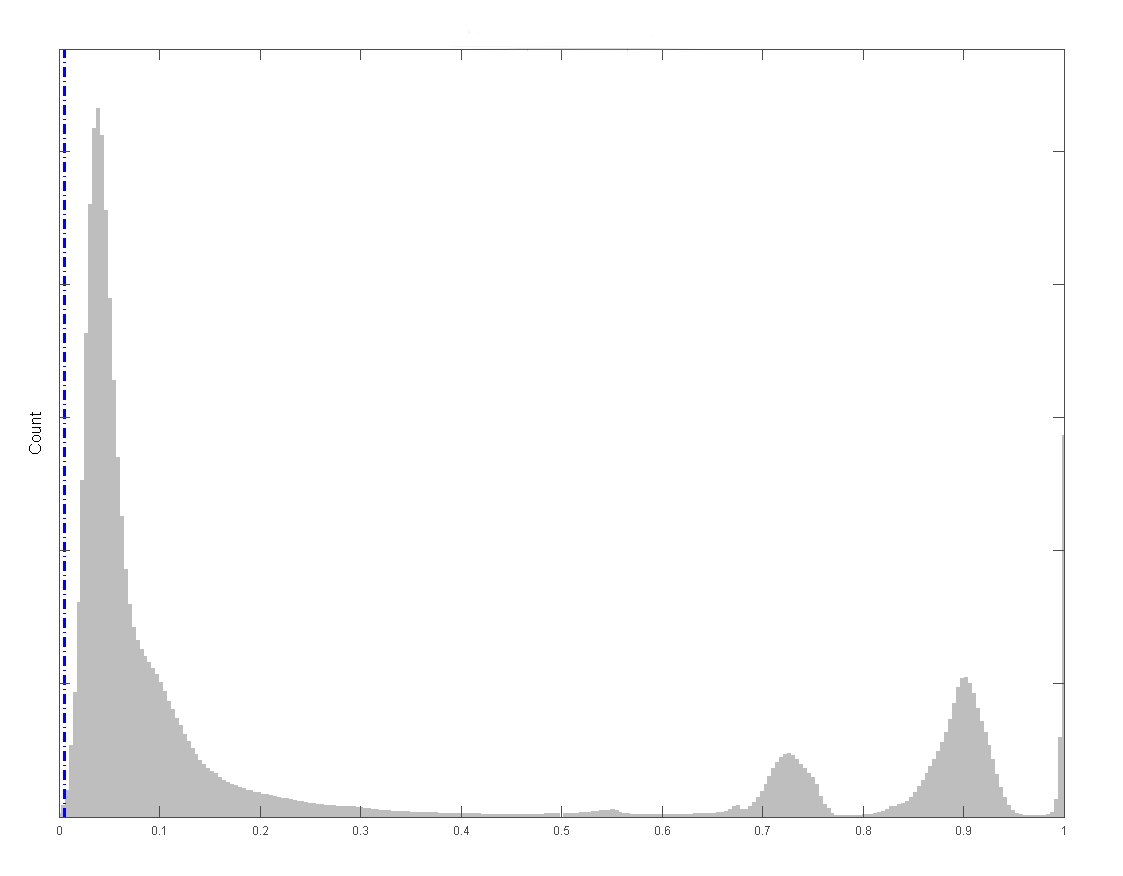
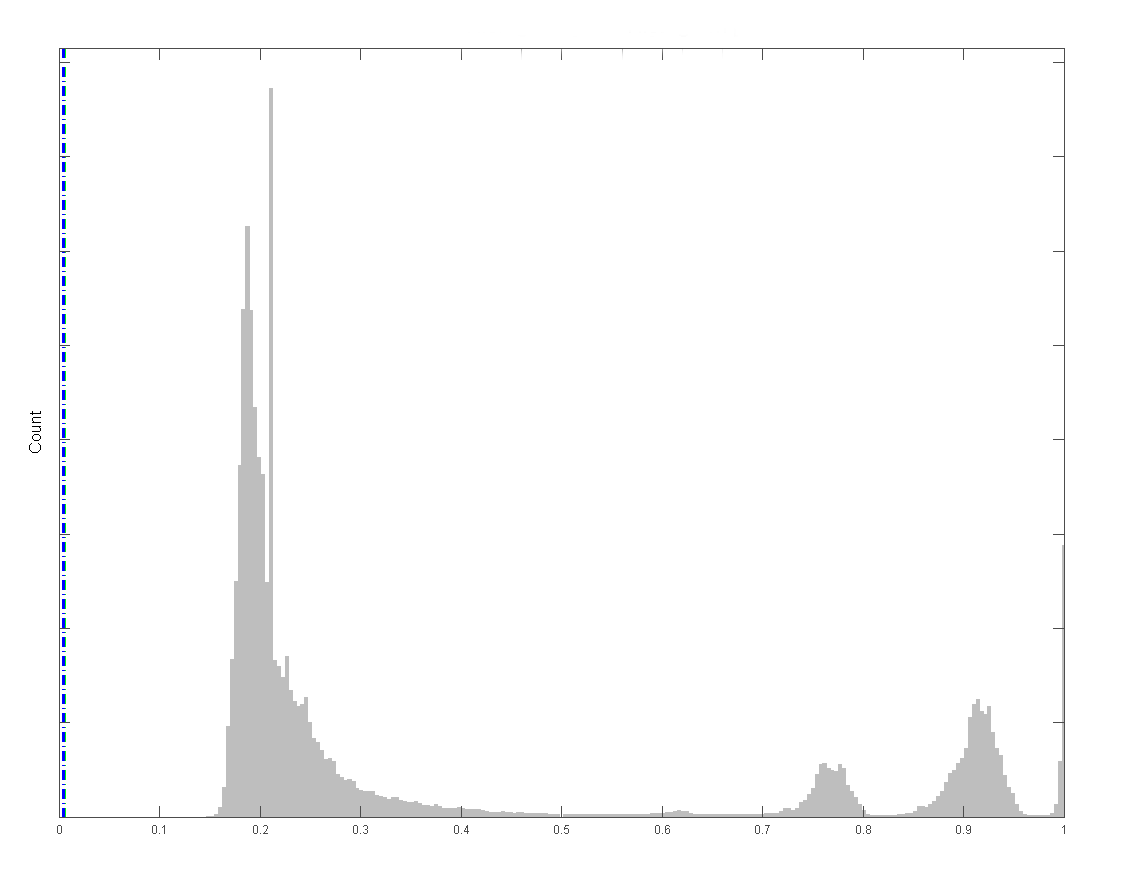
![Histogram results when flare is not or only slightly present in the image. histogram ohne flare 2](/content/news/2018/2018_08_30_flare_ibc/histogram_ohne_flare_2.png)
![Histogram results when flare is present in the image. histogram mit flare 2](/content/news/2018/2018_08_30_flare_ibc/histogram_mit_flare_2.png)
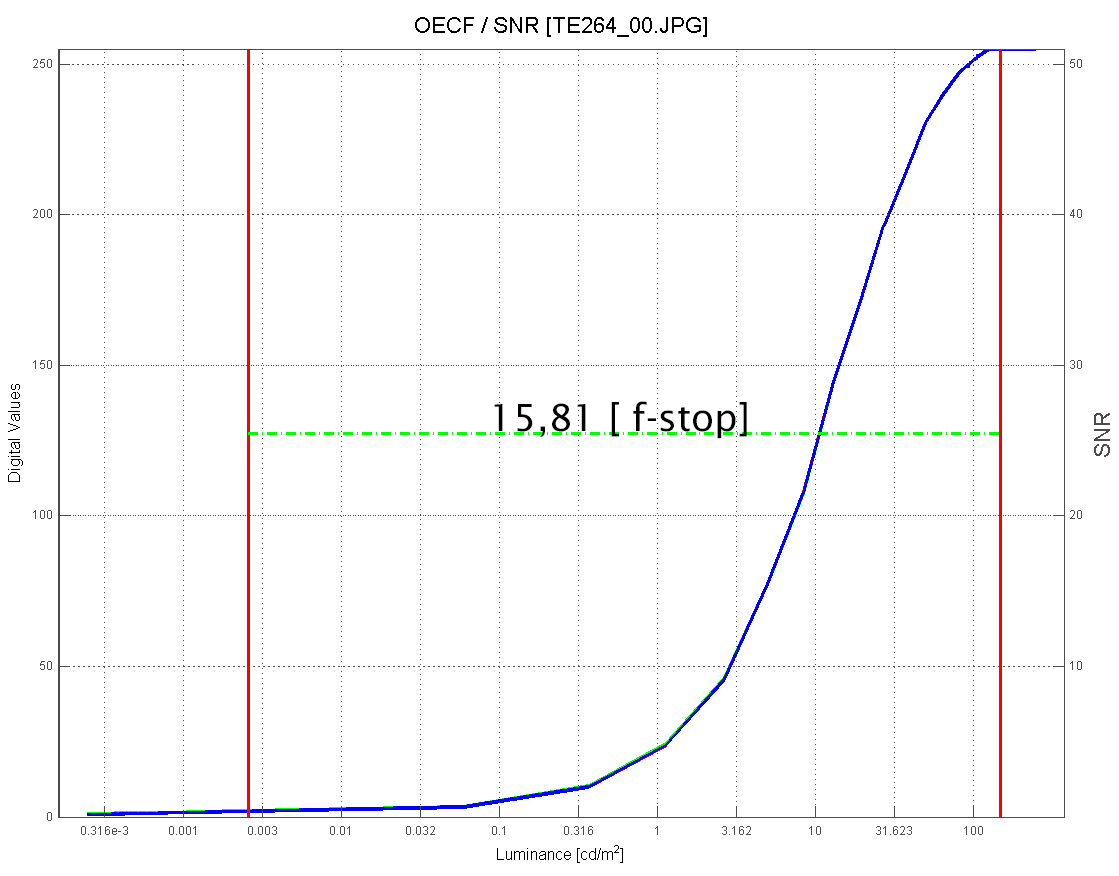
![Typical OECF (gamma) curve when flare is not or only slightly present in the image (result gathered by using TE264 OECF chart). The range of digital values is satisfyingly utilized, and the dynamic range shows a result of 15.81 f-stops (95 dB). iQ Report ohne flare ret](/content/news/2018/2018_08_30_flare_ibc/iQ-Report_ohne_flare_ret.jpg)
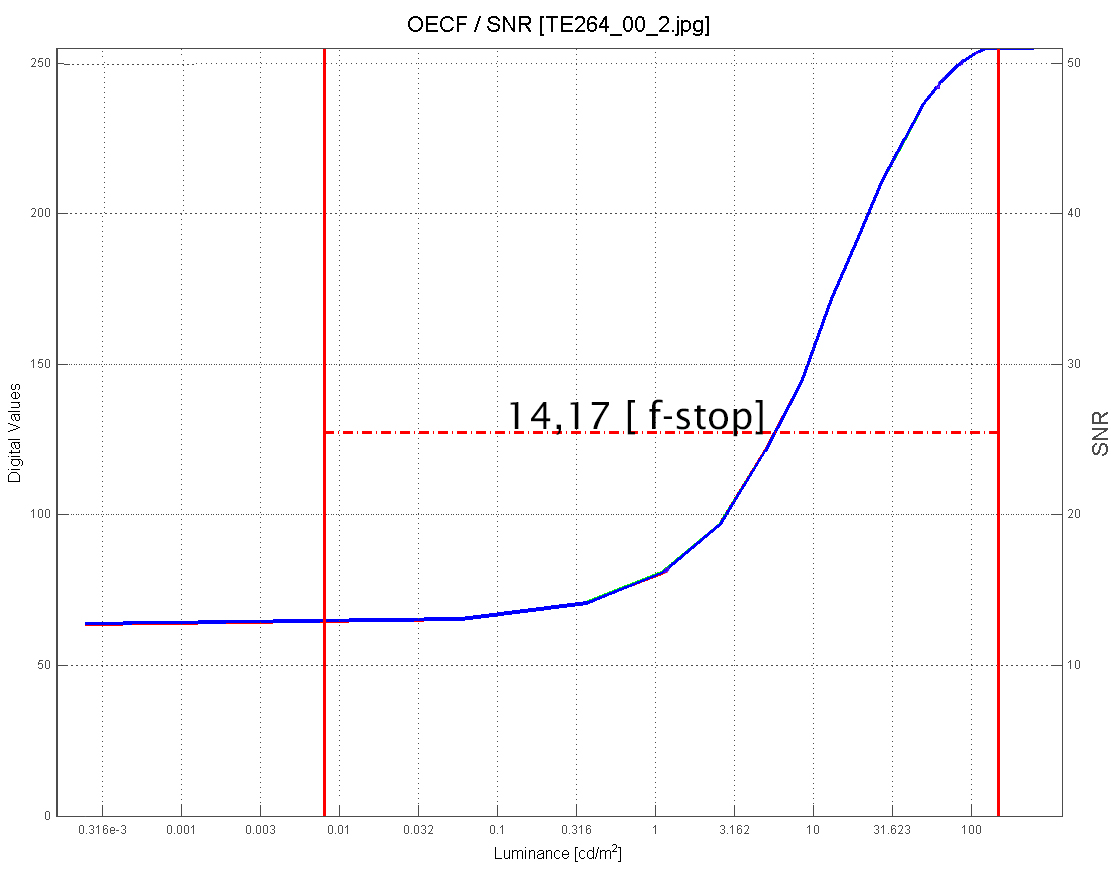
![OECF curve when flare is present in the image. The black level of the OECF curve is distinctly increasing; the minimum digital value is larger than 50. The dynamic range decreases to 14.17 f-stops (85 dB). iQ Report mit flare ret](/content/news/2018/2018_08_30_flare_ibc/iQ-Report_mit_flare_ret.jpg)
How to test for flare?
The Image Engineering test lab always tests cameras according to international standards. As such, the TE281 test chart was specifically designed in line with standard 18844 to determine the amount of lens flare that is added to an image by a camera.
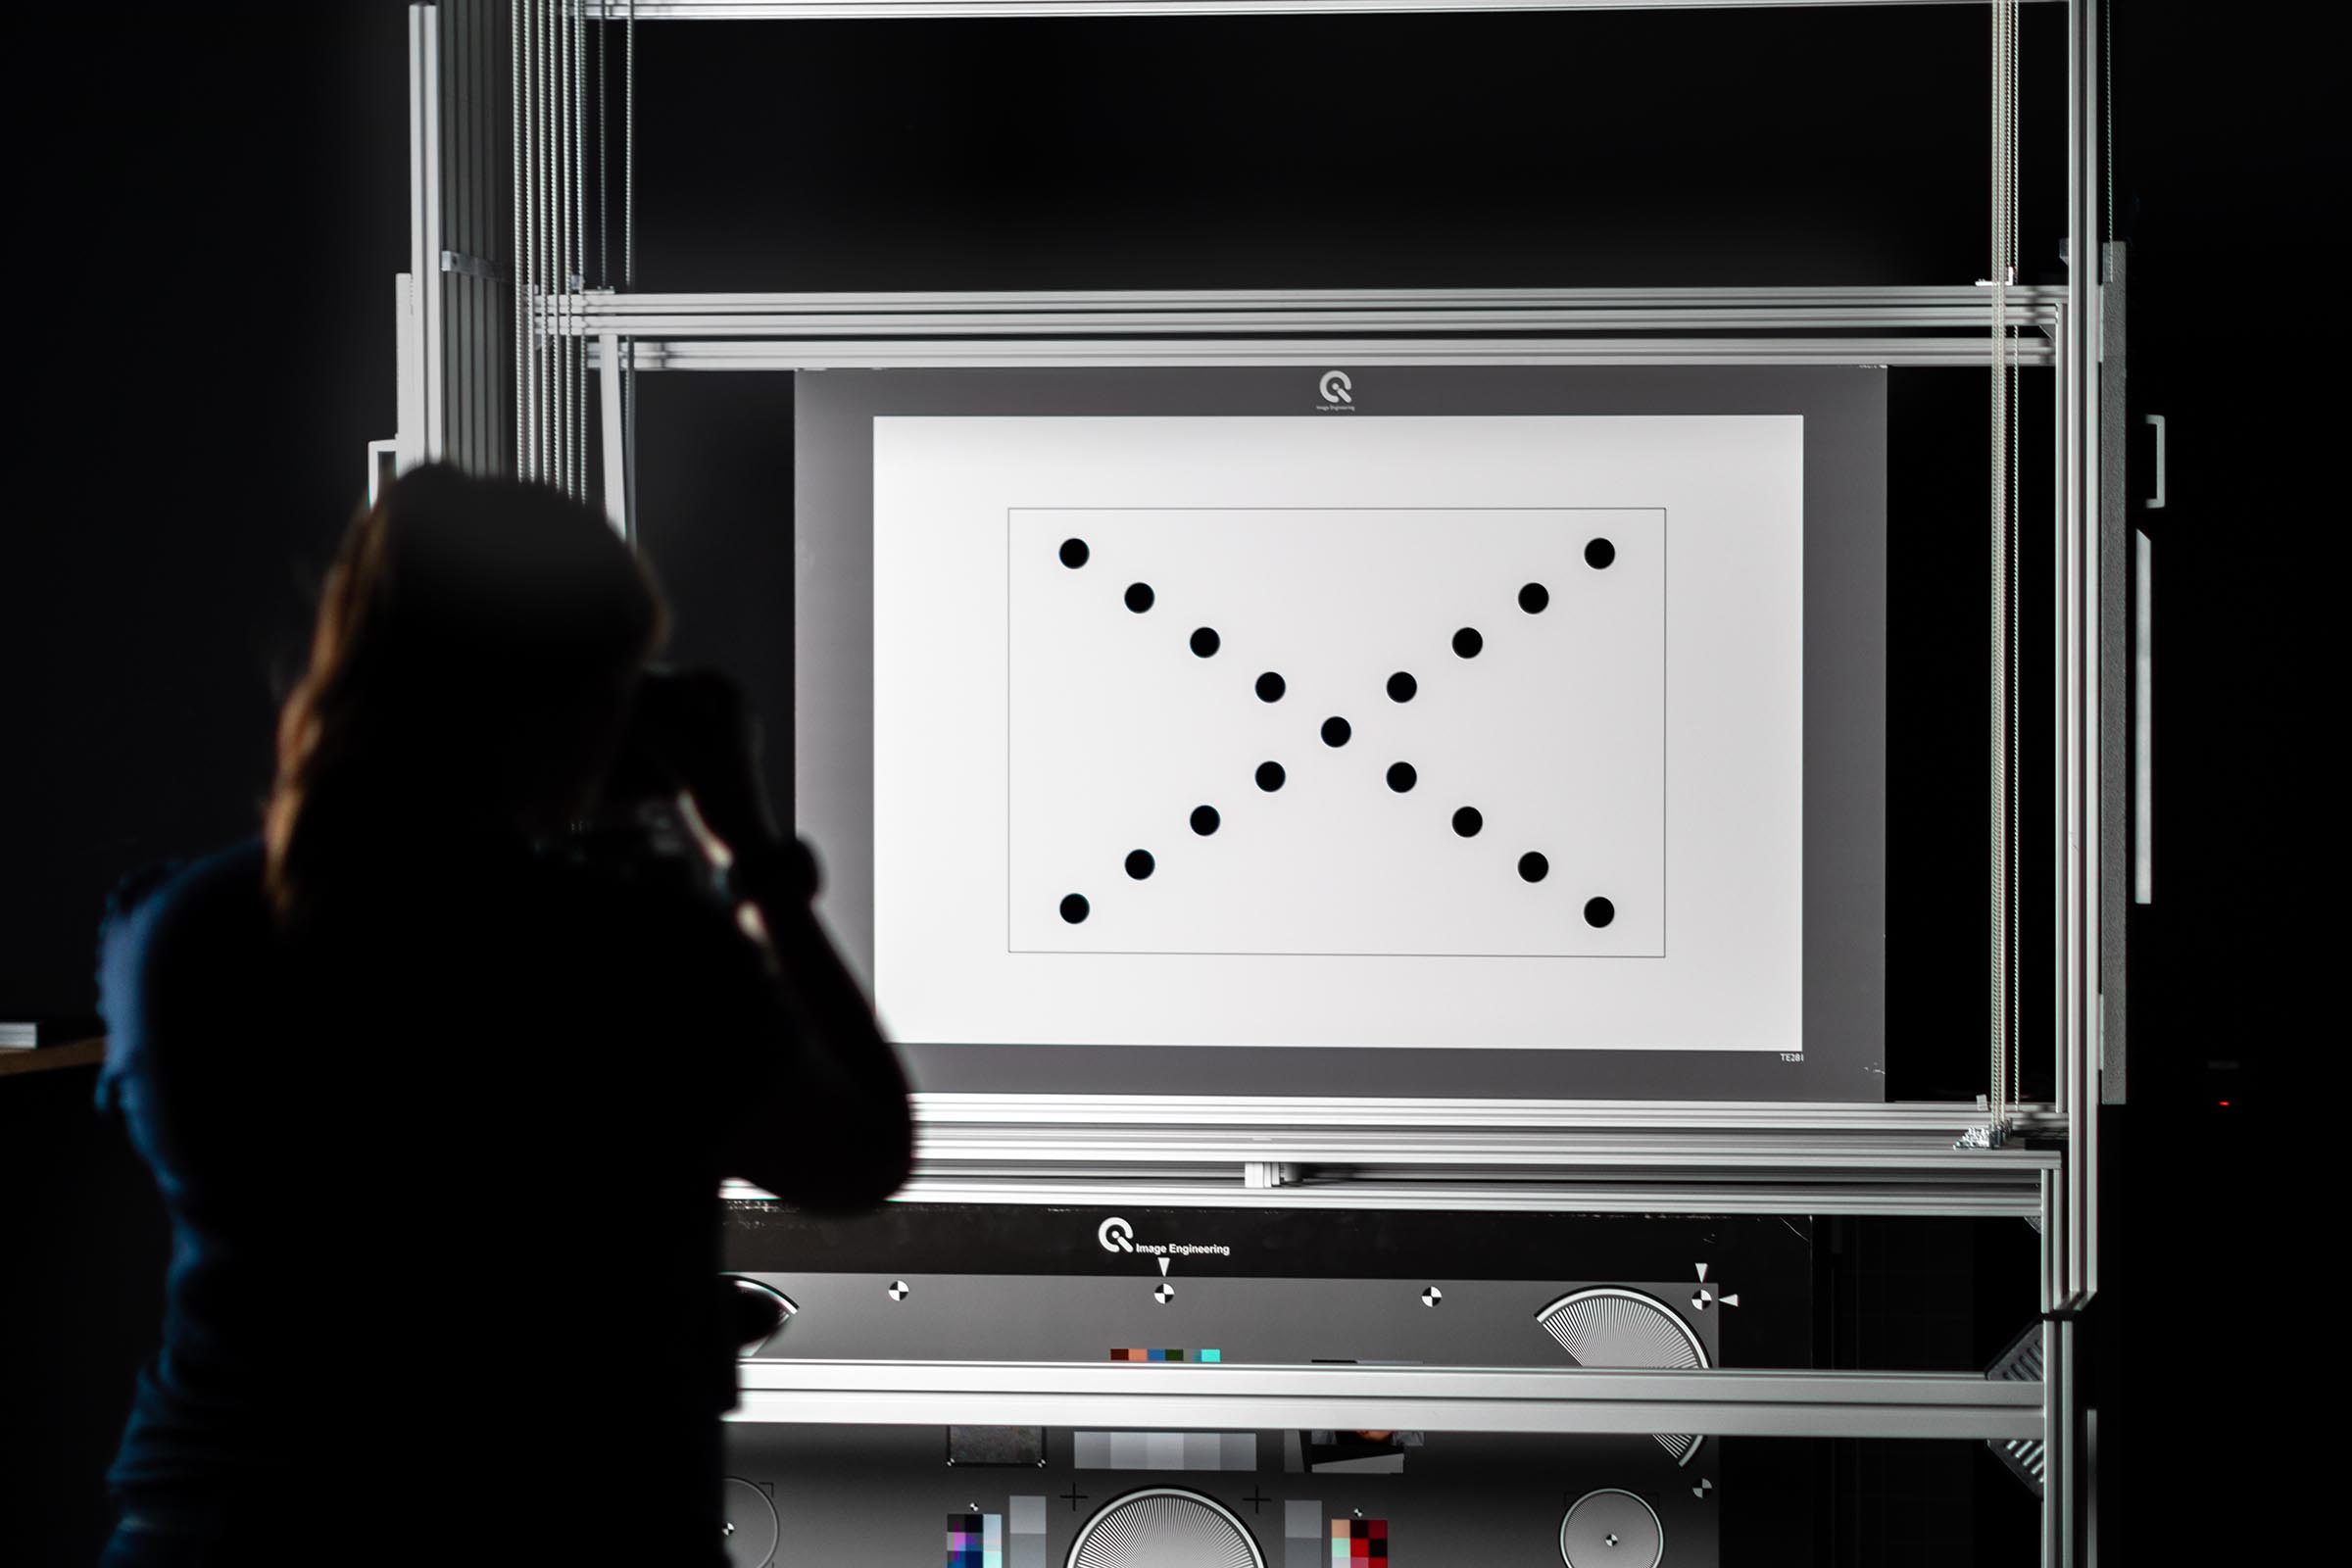
![The TE281 test chart is used by our engineers in our test lab to test a camera for flare. lab test flare](/content/news/2018/2018_08_30_flare_ibc/lab_test_flare.jpg)
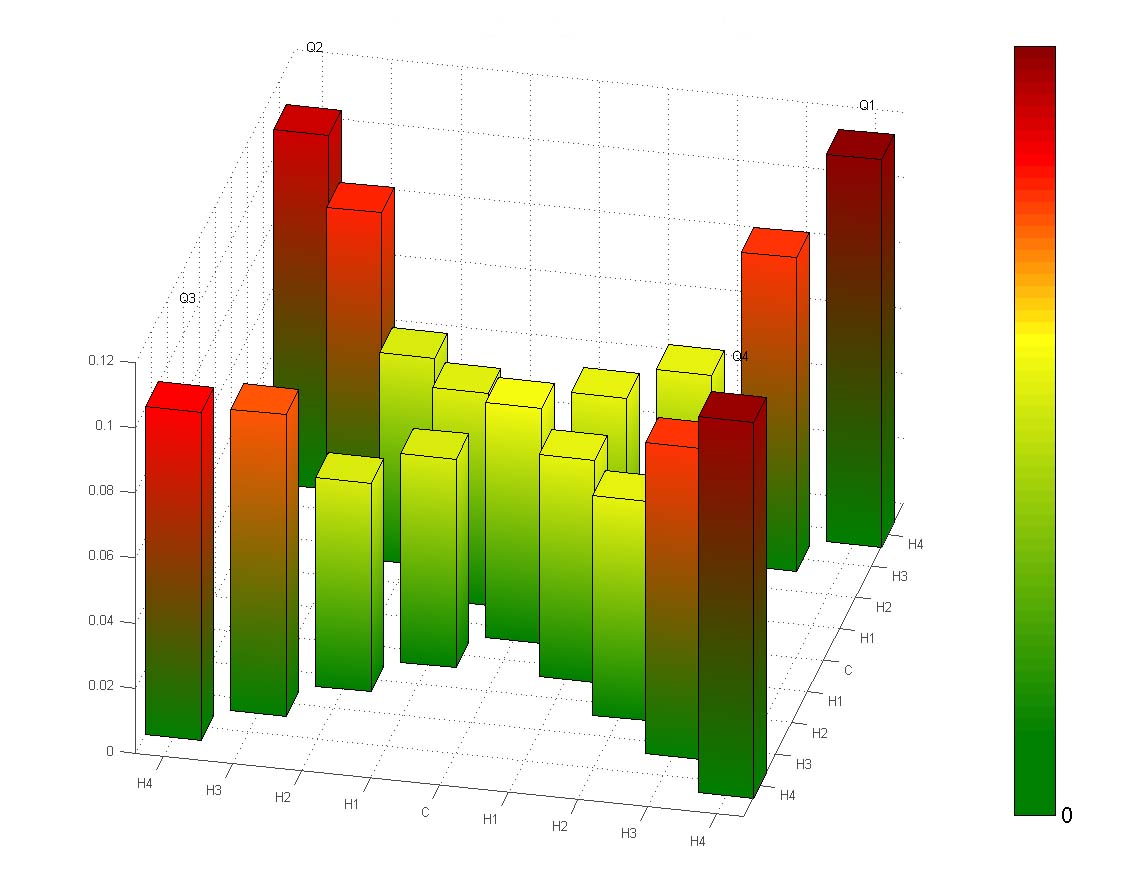
![Result of analyzing the TE281: The flare level changes from the center position to the corner position. In this example, the flare level increases towards the image corners. iQ Report Flare TE281 bar graph](/content/news/2018/2018_08_30_flare_ibc/iQ-Report_Flare_TE281_bar_graph.jpg)
TE281 uses 17 light traps arranged in an X-pattern shape to create the lowest possible level of black. These light traps create a higher contrast on the chart that you cannot get with standard reflective charts. So, if the camera adds flare to the image, the level of black in the traps will increase. Thus, an image quality evaluation software can calculate the amount of scattering light at different image heights.
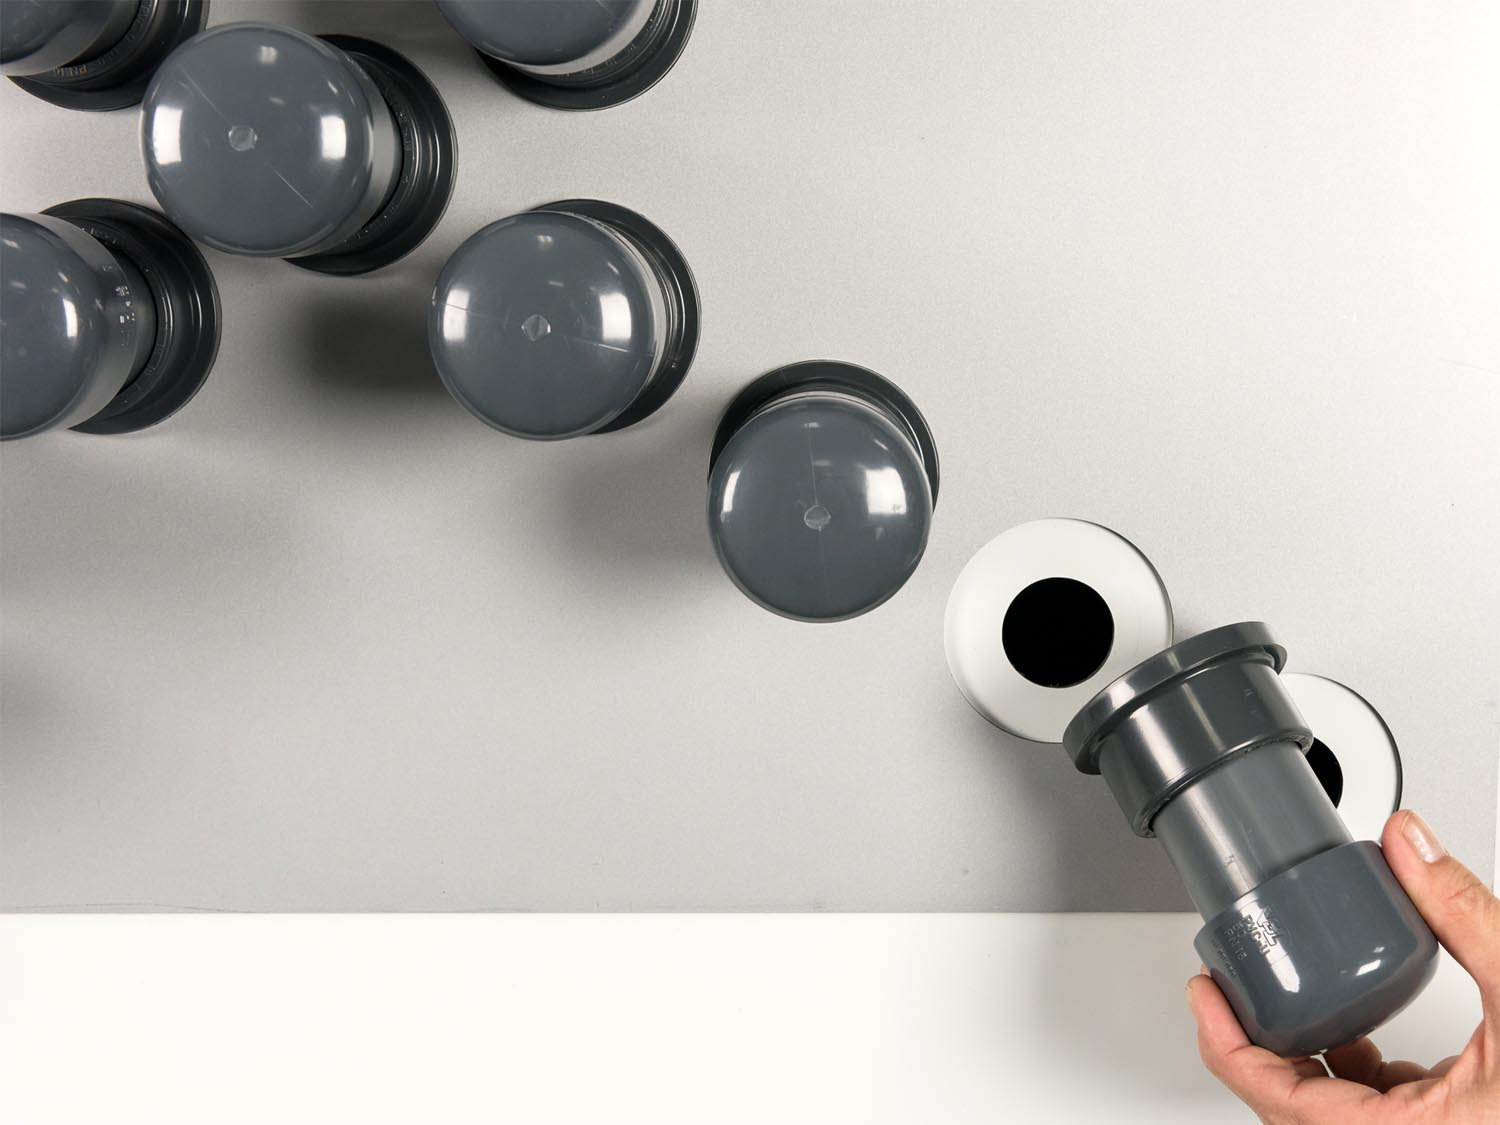
![One of 17 light traps from the TE281 flare chart. TE281 Lichtfallen](/content/news/2018/2018_08_30_flare_ibc/TE281_Lichtfallen.jpg)