The iQ-FoV Box is a tool capable of performing image quality measurements for resolution aspects using a high field of view camera. If you want to know more about this system itself check out our hands-on video or if you are not familiar with the iQ-FoV Box have a look at our website’s product page iQ-FoV Box.
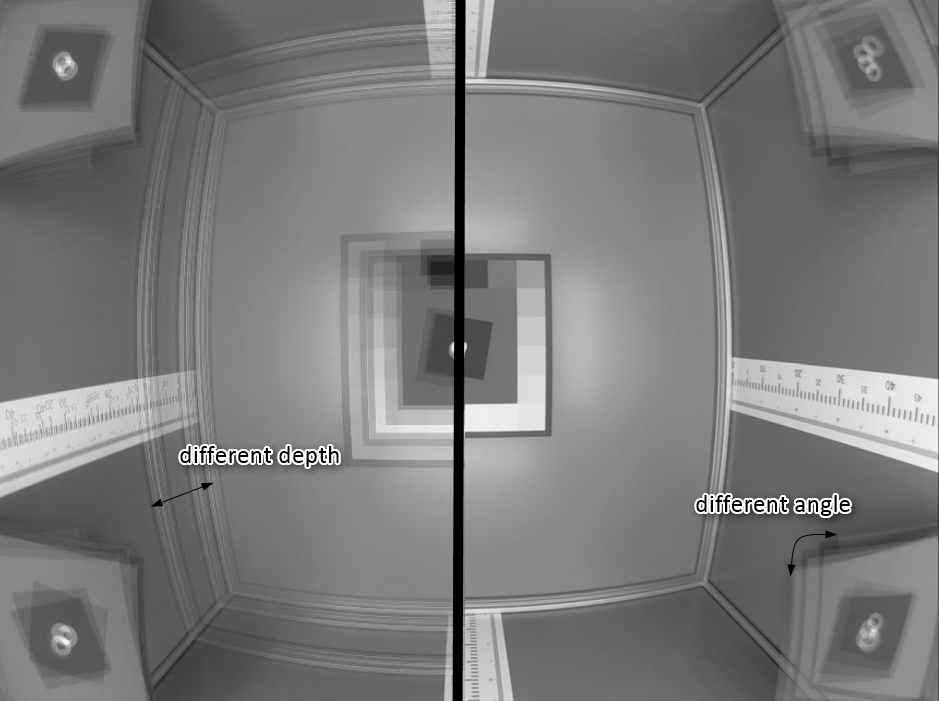
image 1: z-projection of several images taken with the same device in the iQ-FoV Box
There are several degrees of freedom within this measurement, so the results of the resolution analysis may vary widely. These degrees of freedom range from the intrinsic camera parameters (focal length, aperture, etc.) to the hardware setup of the iQ-FoV Box (position and angle of test charts, etc.). The influences of these parameters are hard to predict, but if a few rules are applied, the variations in the results will be minimized. To get the most stable and reproducible results we would like to make a few recommendations:
RECOMMENDATION I
Try to arrange the sub-charts so that the slanted edges appear around 15°. Vertical and horizontal edges should be avoided!
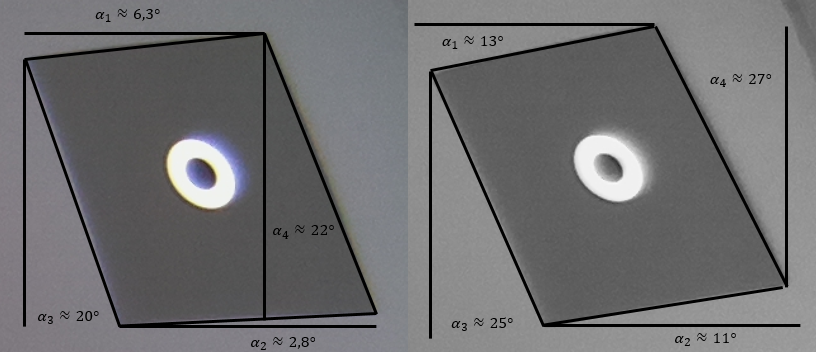
image 2: slanted edge angles
After adjusting the camera’s position, the sub-charts need to be placed properly in the field of view at the desired position (image 4 – center). In this case “properly” means, that the tilt of each angle should be similar to what is shown in image 2 (right). Low tilts may result in inaccurate results due to the SFR algorithm as there may not be enough pixels for oversampling (image 2, left).
RECOMMENDATION II
Log all settings – including camera settings, camera’s x position, sub-chart location, and sub-chart angle, etc. to minimize the variations between the analysis results.
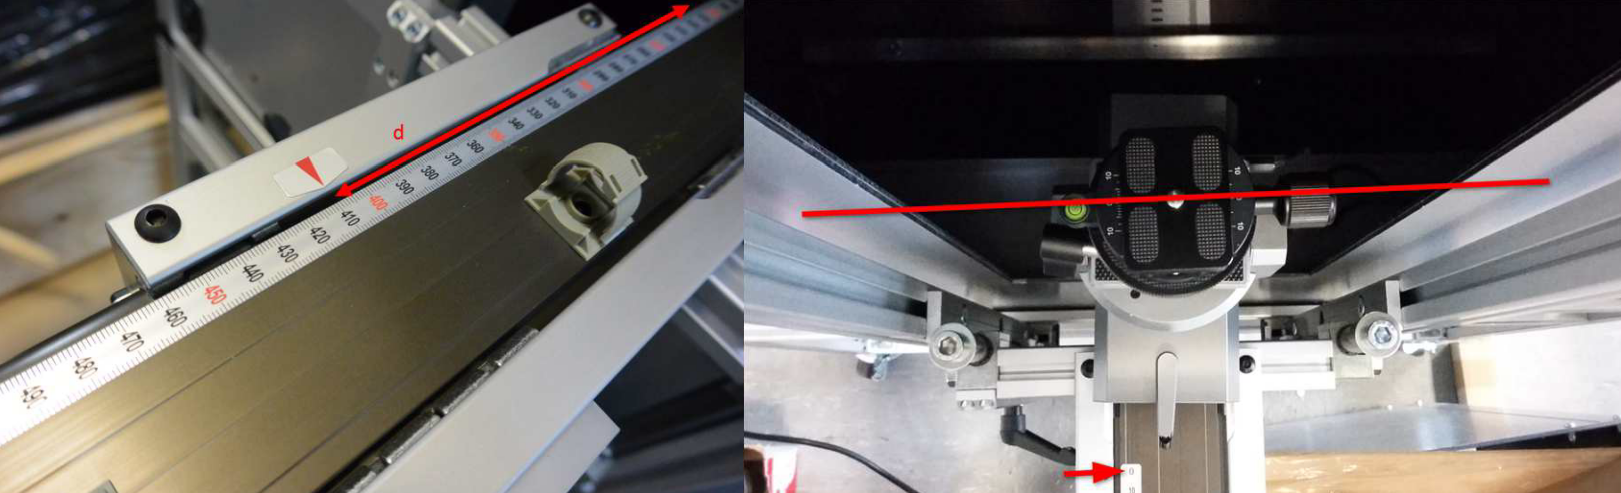
image 3: iQ-FoV Box depth scale and origin
The camera’s x/z position can be logged by using the rulers on/below the linear unit. The position is fixed by design, but may vary due to the camera’s custom mounting system and therefore, should be logged as well.
The positions of the sub-charts have to be logged manually by using tape (see image 4, right). The easiest way to get the sub chart’s angle is to measure the base of the isosceles triangle – see image 4 red arrows.
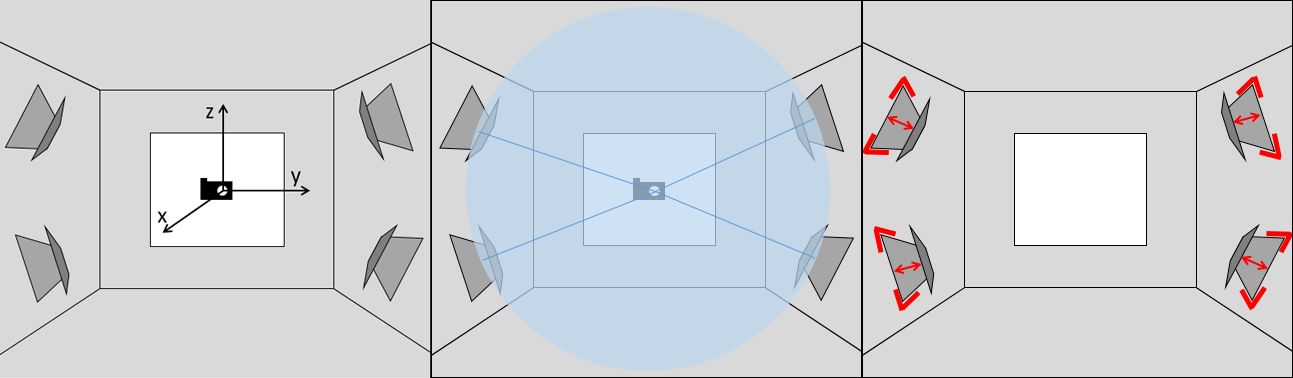
image 4: coordinate system, chart arrangement, marking of sub-charts
RECOMMENDATION III
If comparing similar devices, first determine the accuracy of your system. This will help you to interpret your results as they will slightly vary due to the camera’s data output.
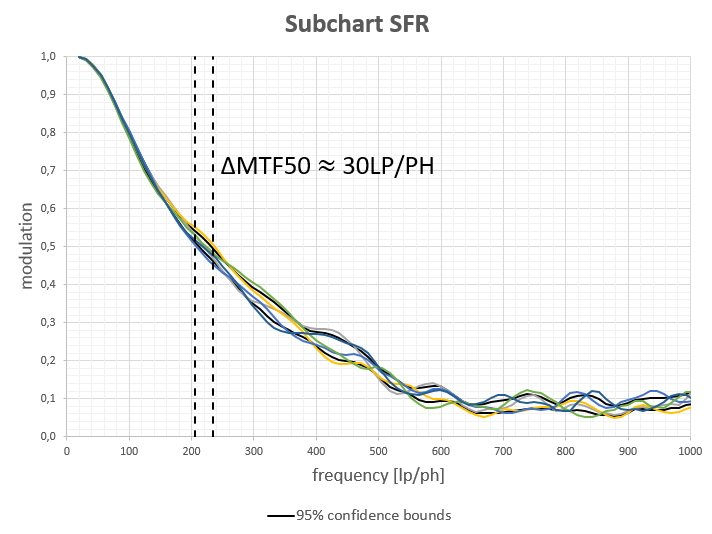
figure 1: SFR
This is a more general recommendation, as you should know how precise the results can be even if there are no changes regarding the iQ-FoV Box hardware. A set of images (>30) should be taken from the same iQ-FoV Box setup and investigated at the derived values (e.g. MTF50 – see figure 1).
RECOMMENDATION IV
If resolution analysis should result from the iQ-Analyzer, make sure that the center target is around 25% - 30% image height and the other sub-charts around 20% - 25% image height.
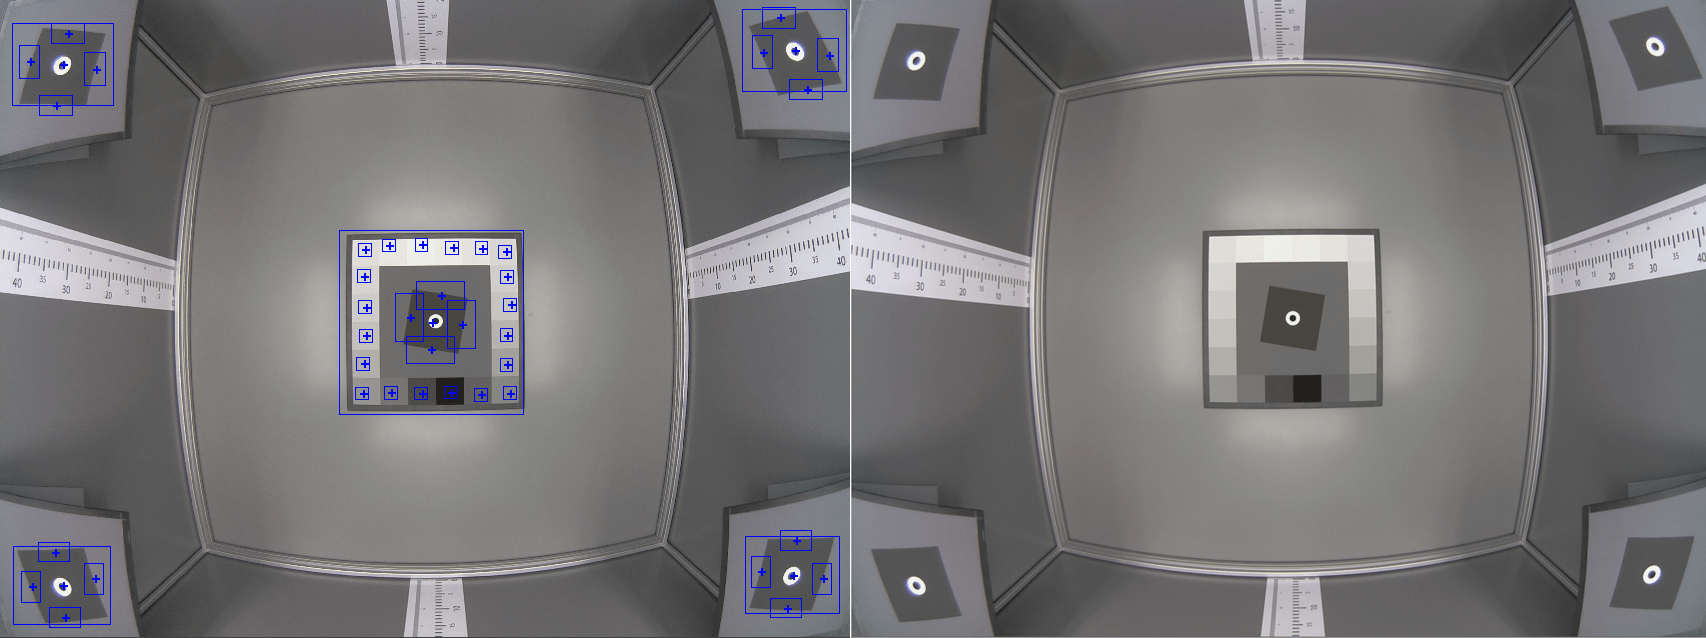
figure 2: automatic detection in iQ-Analyzer