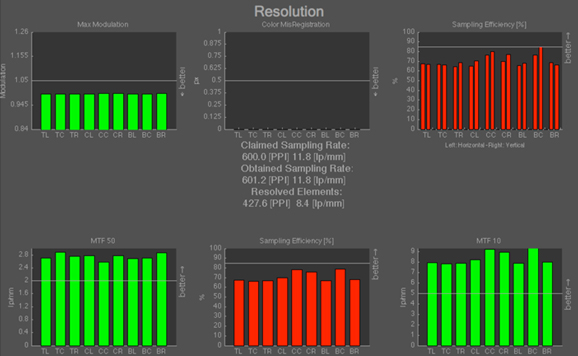
If you are using a scanner, you set the wished sampling rate of the scan. So if you set it to 300 PPI (pixel per inch), most people assume that they really get 300 PPI.  This can happen, but does not have to. If you really care about the sampling rate, you should check in detail. Especially for archives, this is important as people want to check the originals based on the scan. So if they want to know the size of the original, they need to know the real SAMPLING RATE.
To check this, we have to differentiate in different aspects of the sampling rate:
CLAIMED sampling rate and OBTAINED sampling rate
CLAIMED SAMPLING RATE
Most image file formats can store meta information in the file itself. So you can store information about the camera or scanner, the width and height of the image or a complete color profile within the file. One field of meta information is the claimed sampling rate. So the file itself claims to be “300 PPI”. If the file has an standard EXIF meta data section, this is stored in the fields “XResolution” and “YResolution” Together with the field “ResolutionUnit” a software can read this information.
Important to see here: This is only a meta information. This value can easily be changed without changing anything in the image data itself.
Also important to know: If a software can not read this information or the files does not contain this information, it uses a default value. This is in most cases 72 PPI. So if you have an image file and the software shows you 72 PPI as the sampling rate, tis can have two reasons: It really is 72 PPI or the software could not read the information and it uses the default.
OBTAINED SAMPLING RATE
This is the more important value and can not be changed without changing the image data. To get this value, you need to scan a reference. If you know the exact size of the reference, you just have to measure the same distance in the image. To calculate the the obtained sampling rate you use this easy equation:
PPI = distance [pixel] / distance [inch]
If you want to measure in the metric system, you just need to add a factor:
PPI = (distance [pixel] / distance [mm]) * 25.4 [mm/inch]

In the sample here, we have a distance of 60mm in the original which is sampled with 713 pixel. So we have a obtained sampling rate of :
713 pixel / 60mm * 25.4 mm/inch = 301.8 pixel/inch
So you see, this is slightly different to the claimed 300 PPI, but in some case it might be worth to know. If a tool would claim 72 PPI for this image file, you would know that there is something wrong.
RESOLVED ELEMENTS
If the scanner now used 301.8 pixel to sample this original, it does not mean that you have such high resolution. Especially with high sampling rates (like 600 PPI), we hardly see any scanner that really makes use of each pixel.
So if you need to make sure, that a certain structure in the image is resolved, you need to measure the sampling efficiency of the scanner. This can be done by using a high quality chart which shows a slanted edge. From this edge, the SFR (Spatial Frequency Response) can be calculated. With the SFR, one knows which spatial freuqncies the scanner can still resolve and which not. The sample show a real life, high quality scanner. It claims to have a sampling rate of 600 PPI. It obtained 601.2 PPI, which is good. But te really resolved elements, are just 427.6 PPI.

Note: The measurements are performed using the UTT Module in the iQ-Analyzer.
To get detail information about meta data of image files, we can recommend the software “ExifTool” by Phil Harvey.
ua

