In the TechNote ”The concept of noise reduction“ we presented the simple idea behind noise reduction. This idea is based on a seperation of the image in at least two parts (noise and image content). Sometimes it is quite hard to distinguish from noise and image content, especially if you handle with low contrast textures. So if we want to be able to make a statement of how good an algorithm works on that, we have to establish a new numeric quantity, which is called ”kurtosis“.
The term ”kurtosis“
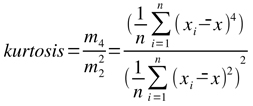
The term kurtosis is used in probability theory and statistics. It describes the peakedness of e.g. a frequency distribution. and is calculated by the following formula:

In the formula, mi is the i-th moment about the mean. A perfect normal distribution would have a kurtosis of 3. If we subtract 3 from the formular above, we get the excess kurtosis. So without going deeper into mathematics, we want to name the three possible results as follows:
excess kurtosis = 0 → mesokurtic
excess kurtosis > 0 → leptokurtic
excess kurtosis < 0 → platykurtic

How to measure kurtosis?
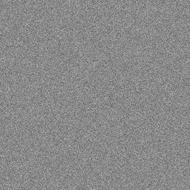
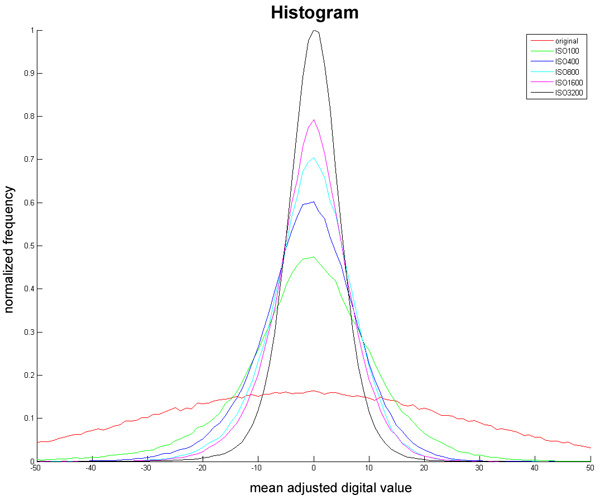
The main idea is to have a patch in a test chart which provides a normal distributed noise pattern. If this pattern is captured by a digital camera, it will be influenced by the denoising algorithms (of course there are many more things which influence the appearance of this noise patch in the digital image, but we won't focus on this right now). The original patch is shown on the right side and the corresponding histogram below (red line). If we apply some very simple denoise filter to the image, the distributon changes its shape and becomes more slender. This is beacause of the frequency removal due to the filter, which ”deletes“ the lower frequencies. As we can see by the shape, there are more values at the same graylevel and so the kurtosis value is greater than zero (leptokurtic). The used filters (blue and green line) just use different thresholds to reduce noise.

Kurtosis at different ISO speed
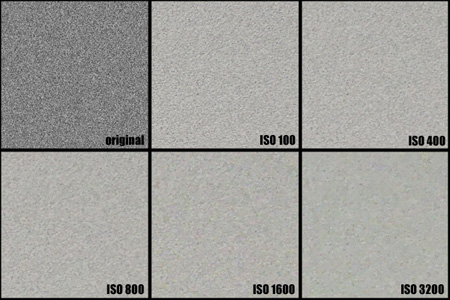
Usually the noise in digital images increase with the ISO speed. According to this the denoise filters are adapted to the ISO speed. The captured kurtosis patch for one camera at different ISO speeds is shown in the image below, the histogram above and the kurtosis values in the table.

| original | ISO 100 | ISO 400 | ISO 800 | ISO 1600 | ISO 3200 | |
| kurtosis | 2.55 | 9.16 | 11.74 | 13.84 | 15.85 | 20.83 |
What does kurtosis tell me about the image quality?
It is recommended to interprete the kurtosis values in combination with noise and resolution measurement. High kurtosis values should go hand in hand with low noise and low resolution. In this case the denoising algorithms are very relentless to low frequencies, but at the cost of loosing the ability to resolve fine structures and textures. If the kurtosis values are low, there are two possibilities:
- clearly visible noise and a good result in resolution could be a indicator for sharpening algorithms
- if there is low noise and a good result in resolution this would be the best case
ck

