Introduction
Camera performance testing is only as efficient as its test equipment. As camera development becomes more advanced and practical (e.g., building modules on a production line), the demand for more effective test methods and, by extension, test equipment has increased. A standard camera test typically includes evaluating the camera's performance for various image quality factors such as resolution, texture loss, noise, dynamic range, color accuracy, distortion, shading, chromatic aberration, etc. A camera system will usually need to be evaluated for multiple factors.
Almost all image quality factors have an ISO standard that lays out internationally recognized test methods and, in many cases, test equipment. Depending on how many factors the device under test (DUT) needs to be evaluated, many different test targets/charts will need to be set up for testing. While still effective, constantly changing a test setup is much more time-consuming. As a result, we have developed a series of multipurpose test charts that contain multiple test targets on one chart plane, resulting in the ability to analyze numerous factors in one image.
These multipurpose charts (known as the TE42 line) have become some of our most popular products, and over the years, we have expanded the line to evaluate even more factors in one test image.
The TE42 test chart line
Each TE42 chart option uses the same grey background and a collection of test targets for measuring the various image quality factors. We currently offer the standard TE42 in its second version, the TE42-LL for low-light testing, and the TE42-LL Timing chart for both low-light and timing measurements.
TE42 V2
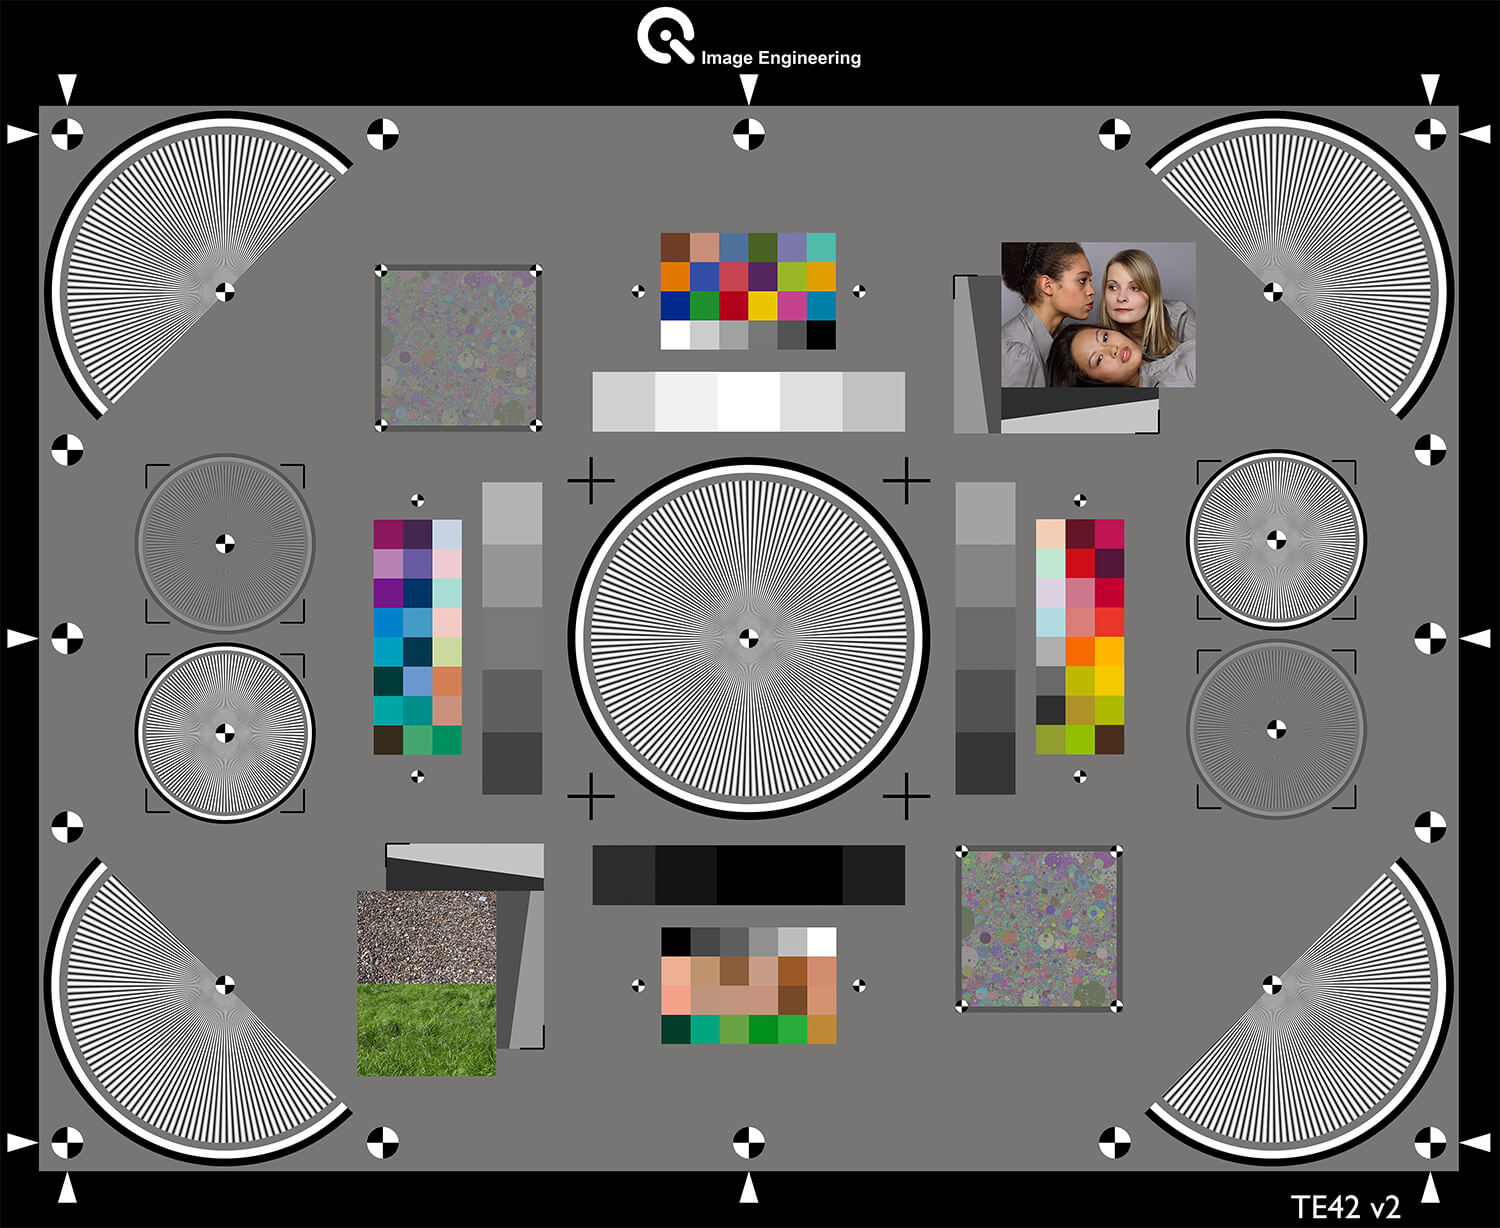
The standard TE42 is a multipurpose test chart that can analyze factors, including resolution, texture reproduction, dynamic range, noise, color reproduction, distortion, shading, chromatic aberration, acutance, and visual analysis. We have designed test targets for each factor in line with the recommendations from the ISO standards when applicable.
Targets include sinusoidal Siemens stars and slanted edges for resolution, dead leaves targets for texture loss, color checkers for color reproduction, and varying greyscales for dynamic range and noise measurements. Also included are small black-and-white targets on the edges of the chart to measure distortion and a skin tone target for visual appraisals.
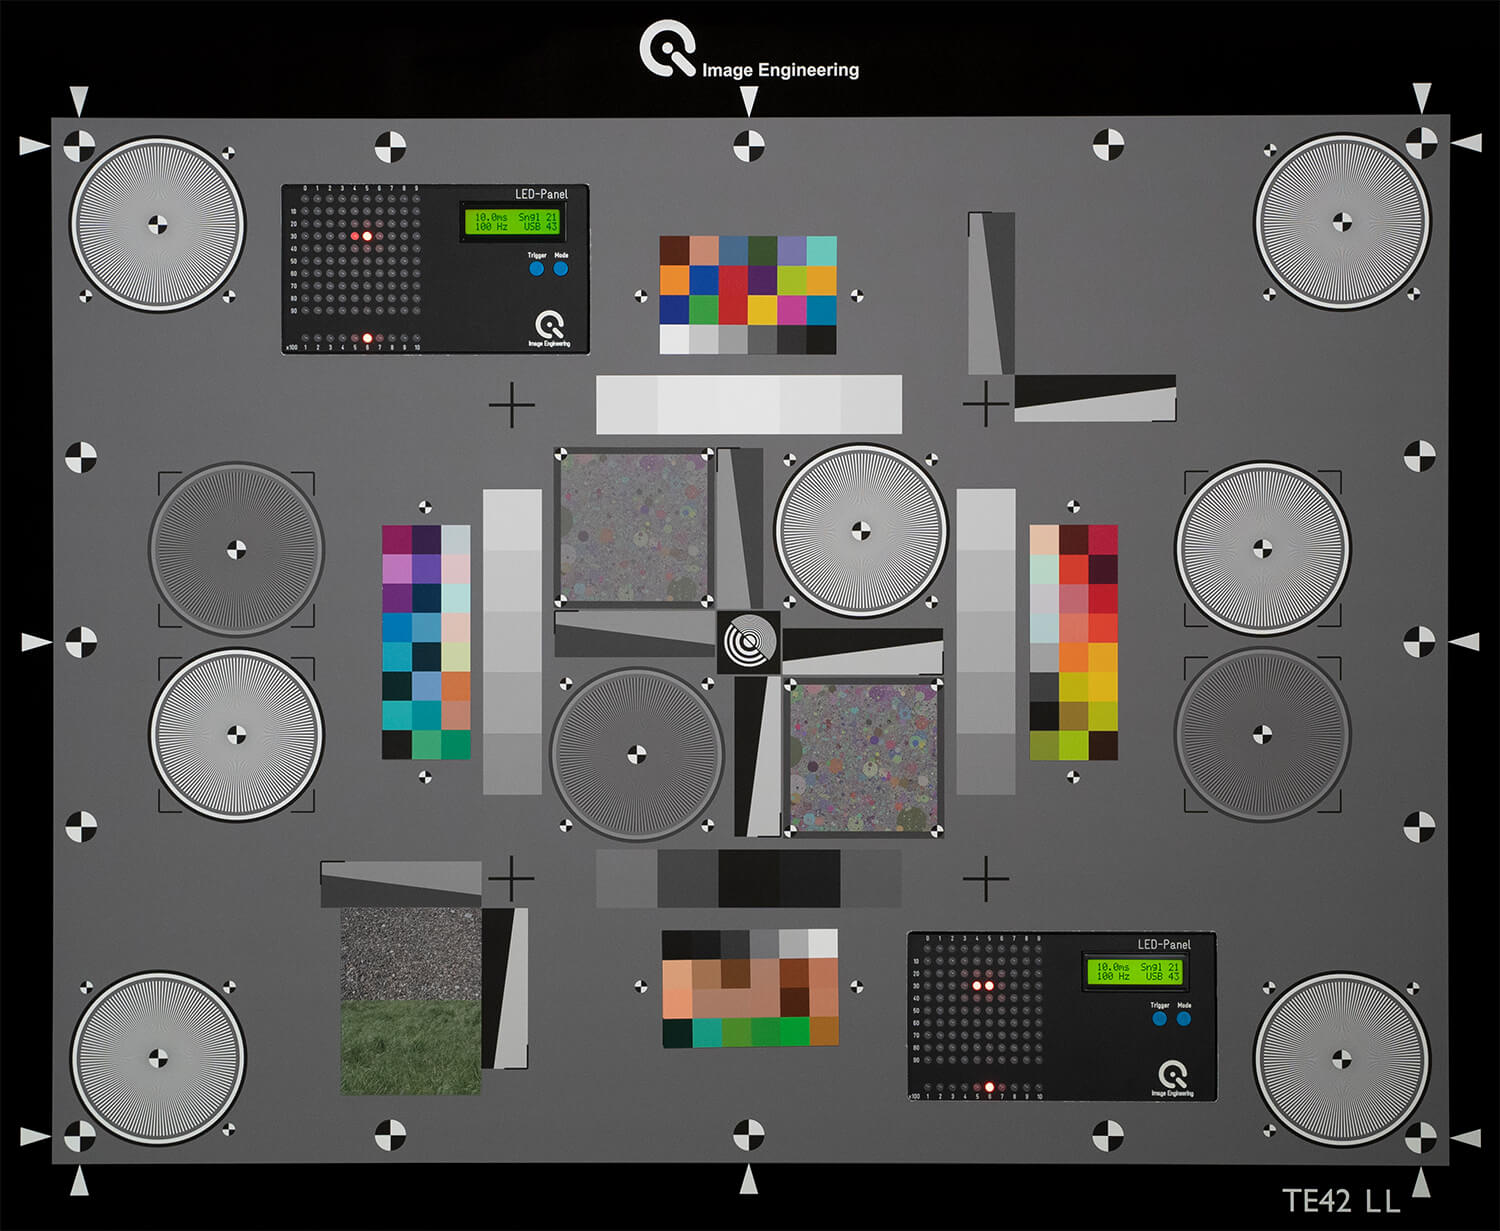
TE42-LL
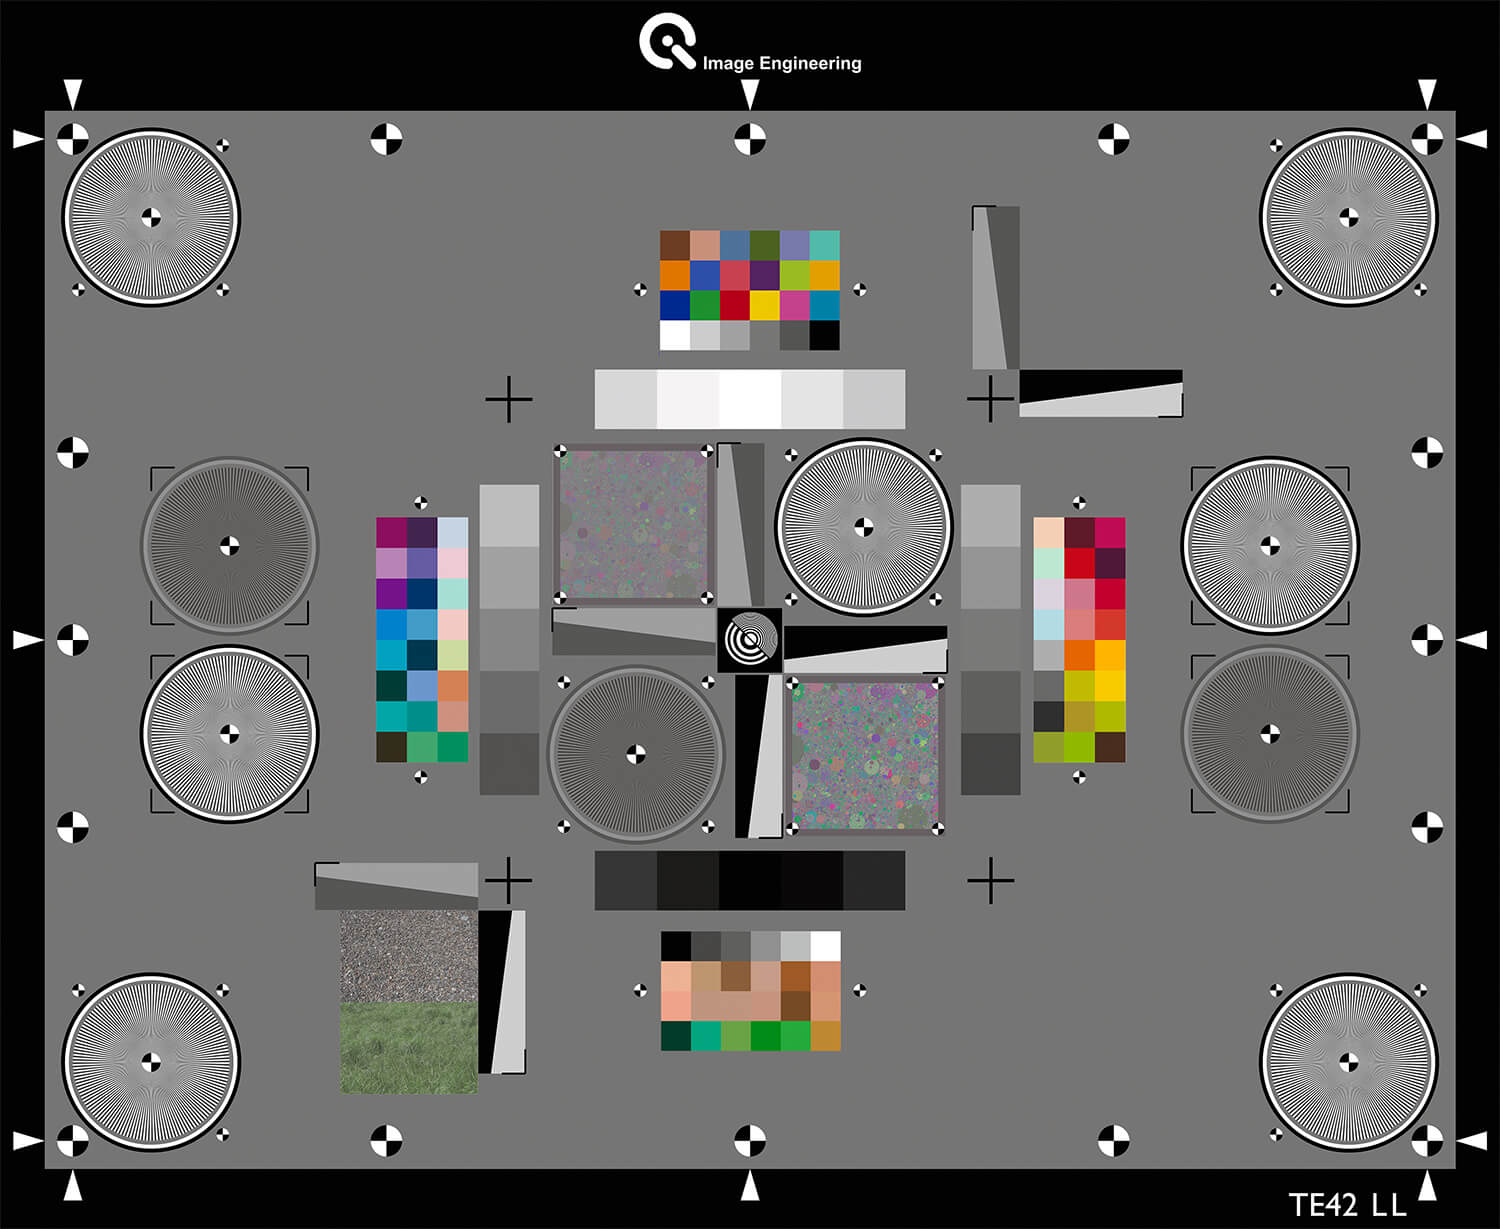
The TE42-LL (low-light) multipurpose chart can analyze all of the same factors as the standard TE42 chart but uses a different arrangement of the targets to maximize low-light testing. This version has many of the same vital targets, such as the low-light Siemens stars, dead leaves, and slanted edges in the center of the chart to avoid the effect of light fall off at the corners when testing in low-light situations. This layout also ensures that all of the targets are equal distance to each other.
In addition, this chart is designed according to the exact specifications in ISO 19093 for low-light testing. It is the chart used in the standard and produced exclusively by Image Engineering. We also typically recommend the TE42-LL over the TE42 when asked due to its versatility in low-light scenarios.
TE42 V2 vs. TE42-LL
We are often asked about which TE42 version we recommend, and for almost all cases, we recommend the TE42-LL version. The reasoning is that the LL version does everything that the TE42 does but is also optimized for low-light testing. As mentioned above, all of the targets are closer to the center to contain light fall off at the chart edges. This chart is also utilized in ISO 19093 for low-light testing and is the main multipurpose chart that our iQ-Lab uses when evaluating camera systems according to the VCX standard. Overall, we have found that the TE42-LL can provide more advanced testing scenarios compared to the standard TE42 V2.


TE42-LL variations
We also offer two variations of the TE42-LL to enhance the testing capabilities of a lab. These variations are optimized for low-light testing scenarios.
TE42-LL UW
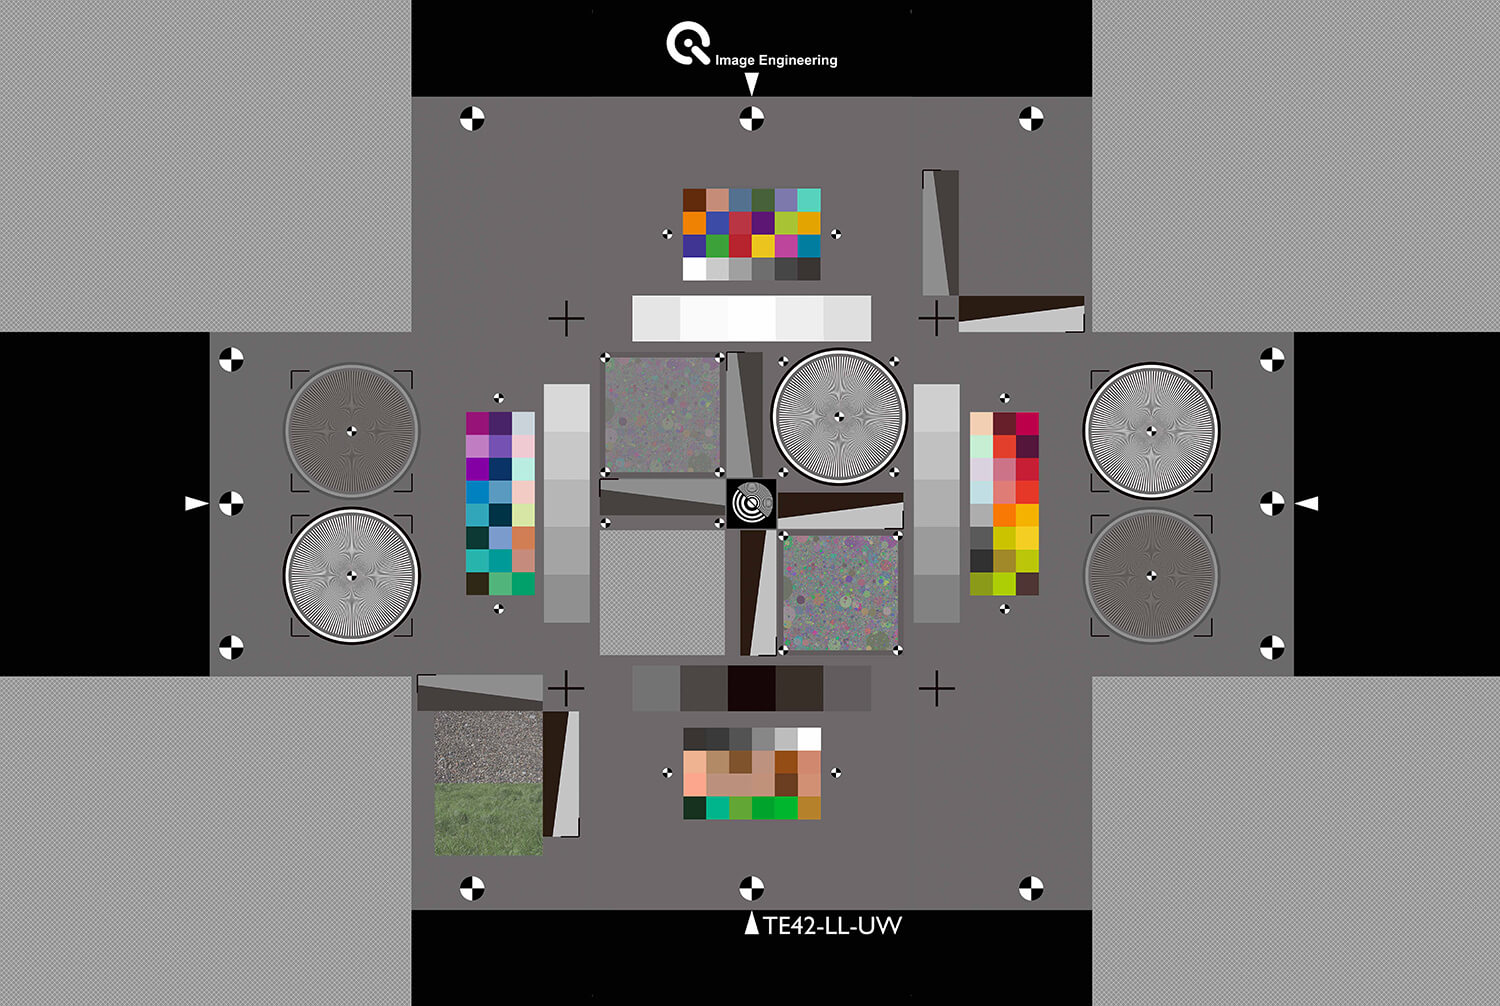
TE42-LL UW (Ultra-Wide), developed for more accurate measurements of wide-angle camera systems, uses a pattern in the chart's corners and center, which features five fixed spatial frequencies that can be analyzed. This design allows high flexibility regarding the location of the measurement region. The pattern is more prominent in the corner, so even strong barrel distortion allows measurement in the image corner.
TE42-LL 2AR
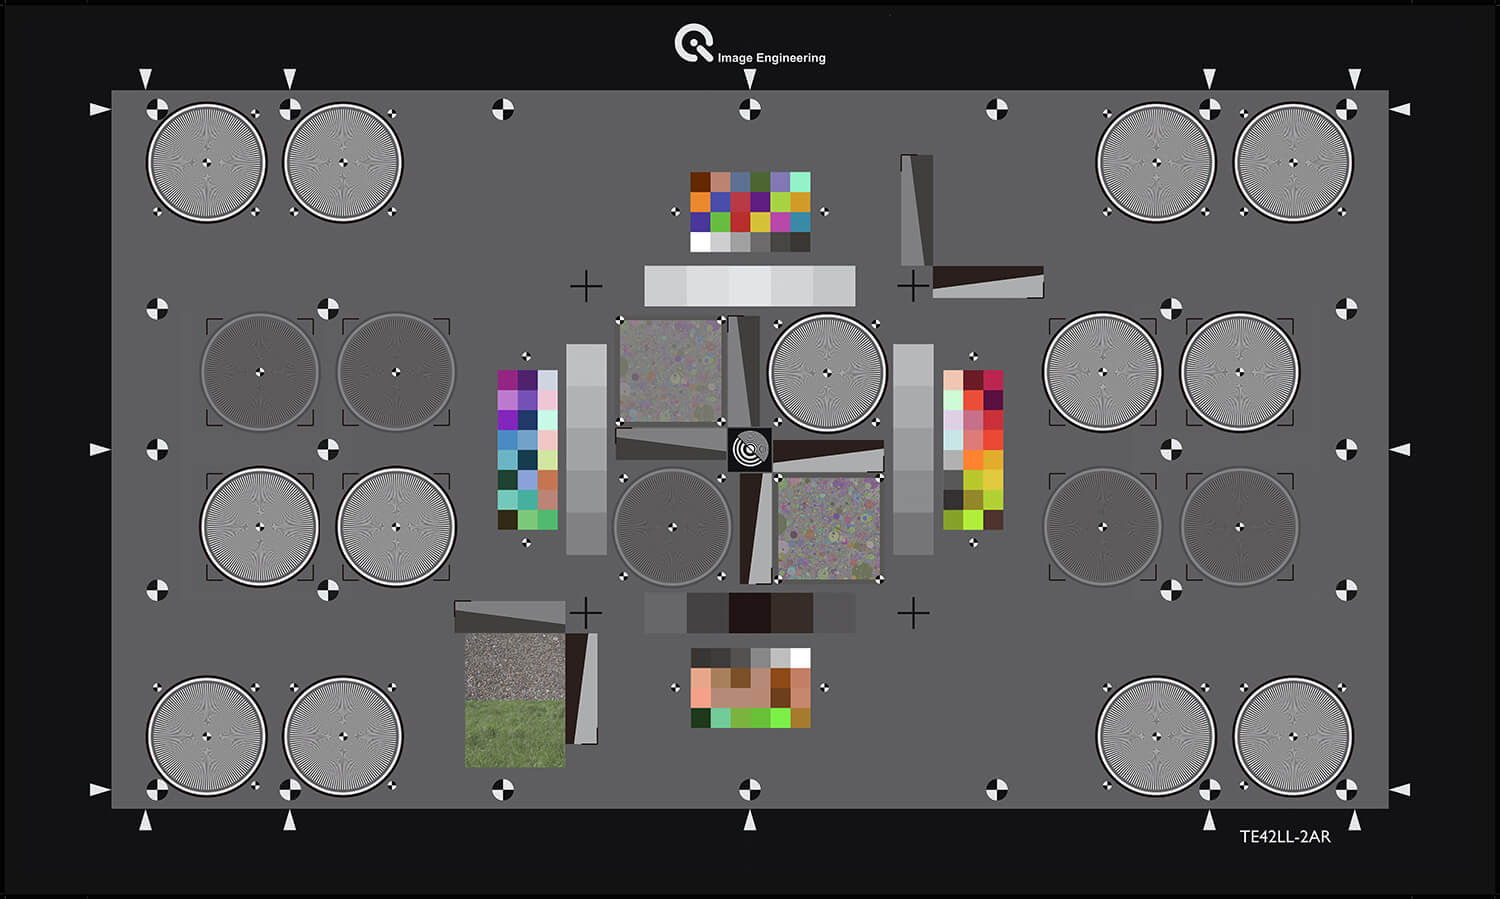
The TE42-LL 2AR (2 aspect ratios) version combines 4:3 and 16:9 aspect ratios on one chart plane for even more efficient camera testing. The center of the chart will stay exactly the same as the original TE42-LL test chart, but now, extra Siemens stars are added on the outside to account for the different aspect ratios.
TE42-LL Timing
The TE42-LL Timing chart is the same exact chart as the TE42-LL, but we have installed two LED-Panels for timing measurements. This chart is based on the requirements of the VCX standards for mobile phone and webcam testing. The LED-Panels are built into the test chart's upper left and lower right corner. We use two LED-Panels at different heights to ensure the tester can see the DUT's rolling shutter effects.
With an LED-Panel, you can measure a camera system's important timing parameters, including shooting and shutter time lag, autofocus time, rolling shutter speed, exposure time, frame rate, display refresh rate, and startup time.
The TE42 chart line is utilized in test labs worldwide, including in our iQ-Lab, where we use these charts daily when evaluating a camera system's image quality performance.
Universal Test Target (UTT)
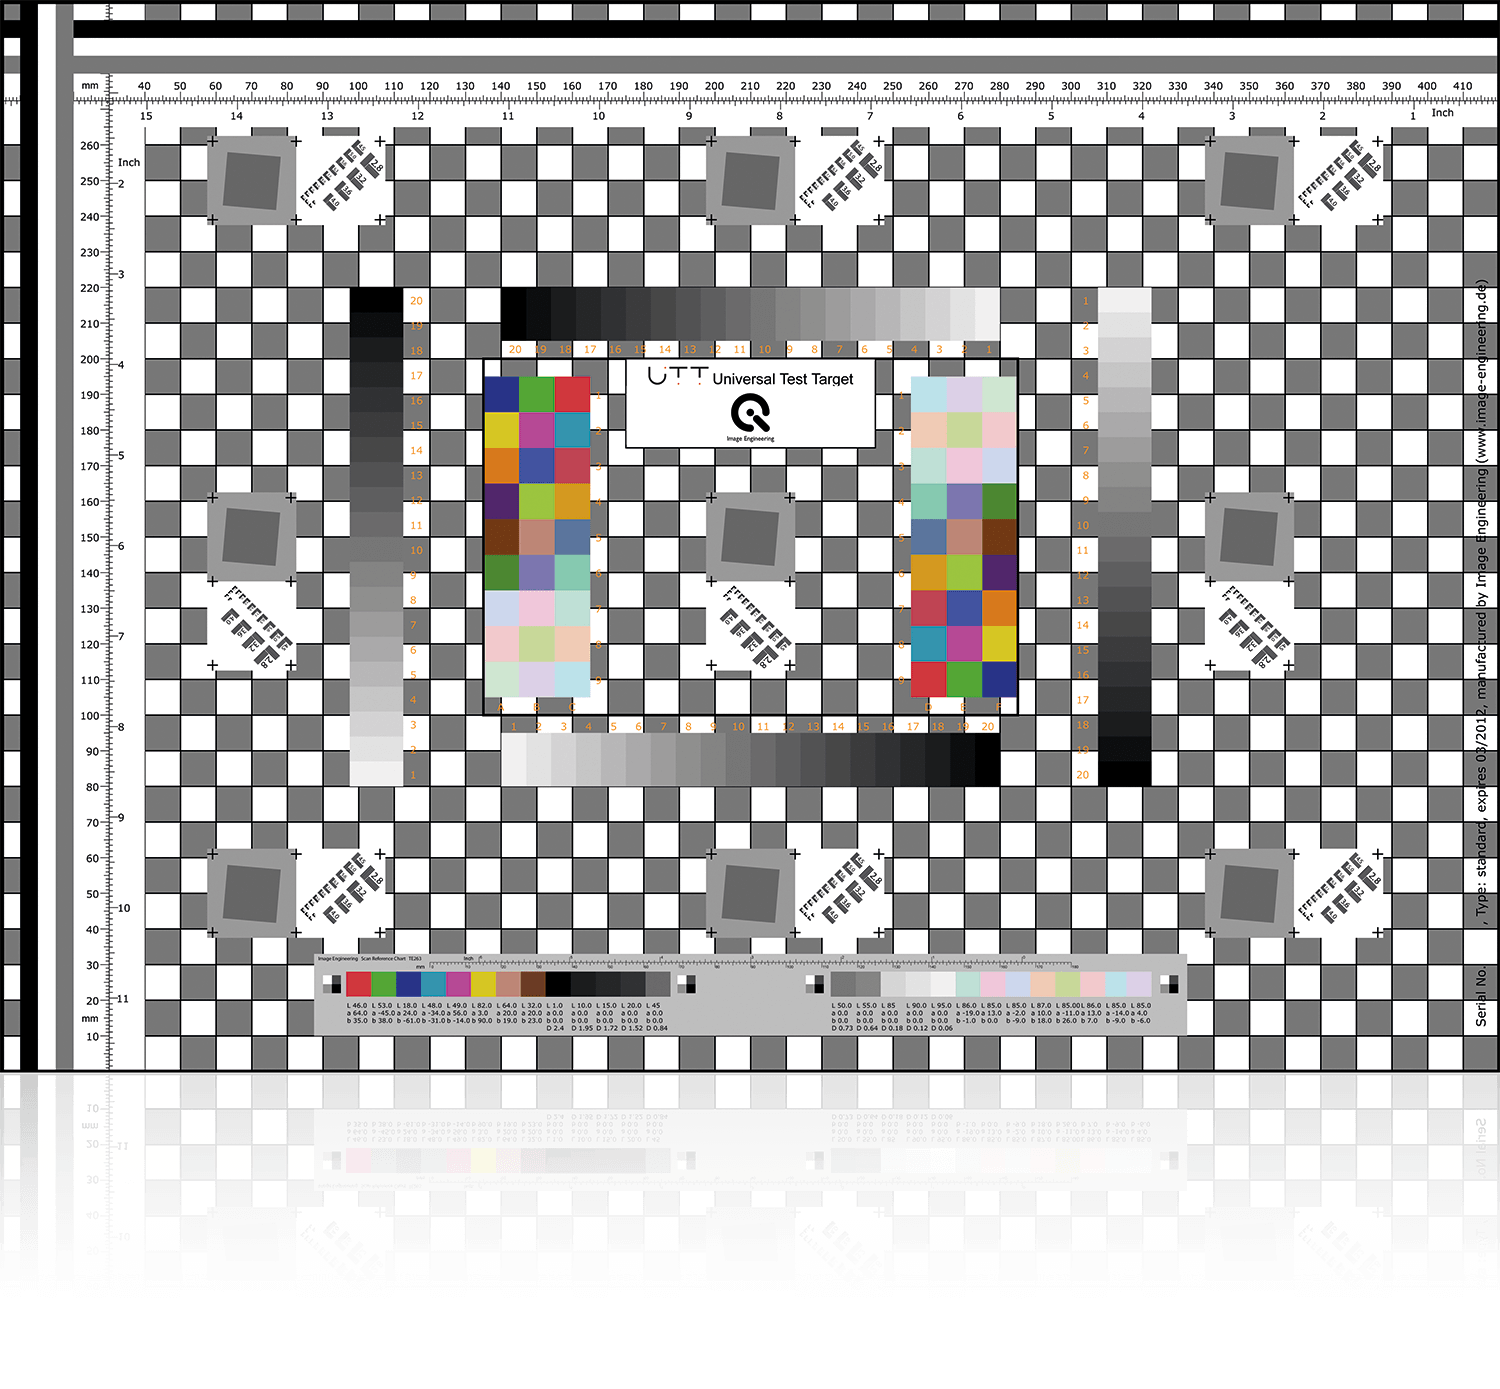
In addition to the TE42 series, we offer other multipurpose test charts for evaluating multiple factors in a single image, most notably the UTT. The UTT chart evaluates the image quality of scanners and other digital devices that create digital images of documents, photos, and other archiving media. The chart includes color checkers, grayscales, and slanted edge targets for measuring various factors.
Setting up a test lab
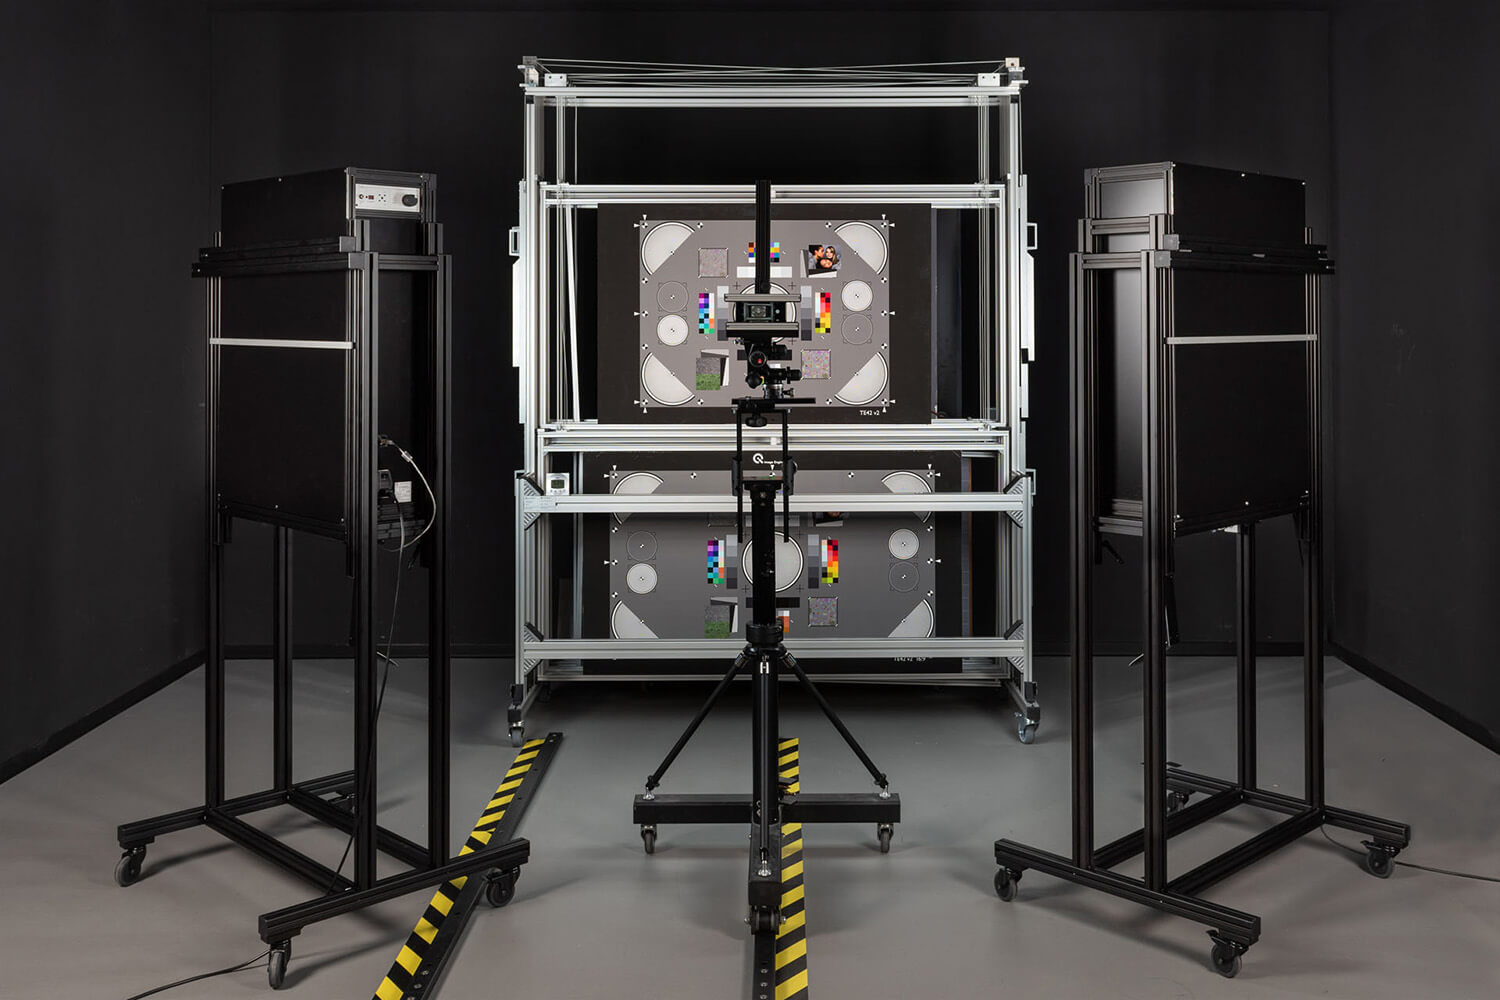
It is essential to have proper illumination to maximize the effectiveness of these multipurpose test charts. We recommend the iQ-Flatlights, which are powered with iQ-LED technology and allow you to generate custom spectra in a range of 380 – 820 nm. When positioned correctly, they offer uniform illumination for reflective test charts such as the TE42 line and the UTT.
In addition to illumination, we also offer the iQ-Analyzer-X for evaluating test results. Results from each of the TE42 charts and the UTT can be evaluated with the software to detect performance issues with the DUT. The iQ-Analyzer-X software uses a flexible UI interface and automatic chart detection to magnify the effectiveness and speed of the analysis. The software can also analyze individual reference data, save the results and image files to a local database, and implement custom test templates.
The iQ-Analyzer-X, paired with a multipurpose test chart, creates a powerful solution for evaluating the image quality performance of a camera system.
Contact us
Contact us at for more information on our multipurpose test charts.

