The Signal to Noise ratio (SNR) is a well known and commonly used metric to describe the noise behavior of a digital camera.
Several studies show that the SNR does not describe the perception of the human observer. So two cameras can have the same SNR value, but the noise is totally different in its perception. The Visual Noise metric is a solution for this problem, as it takes the viewing condition and the “Contrast Sensitivity Function” (CSF) of the human visual system into account.
Visual Noise was described in the ISO 15739:2003 standard and changed from an informative Annex to the normative part in the ISO15739:2013 revision. During the discussions for the ISO15739 revision, a reference implementation was created with the active help of Image Engineering. There are small changes from the first implementation (used in the iQ-Analyzer since 2007) to the current reference implementation in the iQ-Analyzer Version 6.
In this techNote, we want to explain the differences between the ISO reference implementation (iQ-Analyzer Version 6) and the previous (iQ-Analyzer Version 5) implementation:
Chromatic Adaptation
The RGB image data is transferred into the XYZ colorspace and then into the ACC colorspace also called opponent space prior to frequency filtering. For the needed chromatic adaption, the algorithm according to Bradford is used instead of van Kries.
XYZ to CIE-Luv Transformation
The VN metric is based on the spatially filtered CIE-Luv representation of the input image data. During the frequency filtering, it might happen that impossible negative XYZ values are created. Negative values are now set to zero instead of using the absolute value.
Instead of using D50 as reference white point for the transformation into CIE-Luv, it is D65 now.
CSF calculation
The C2 component of the CSF has now a slightly modified constant factor.
Fourier Transformation
During the Fourier Transformation (and the inverse Fourier Transformation) the DC component is forced to zero and added after the filtering again. In the reference implementation it is made sure, that the DC component remains at 0 during the filtering.
See this techNote for the details of the Visual Noise approach:
Noise: SNR vs. visual noise
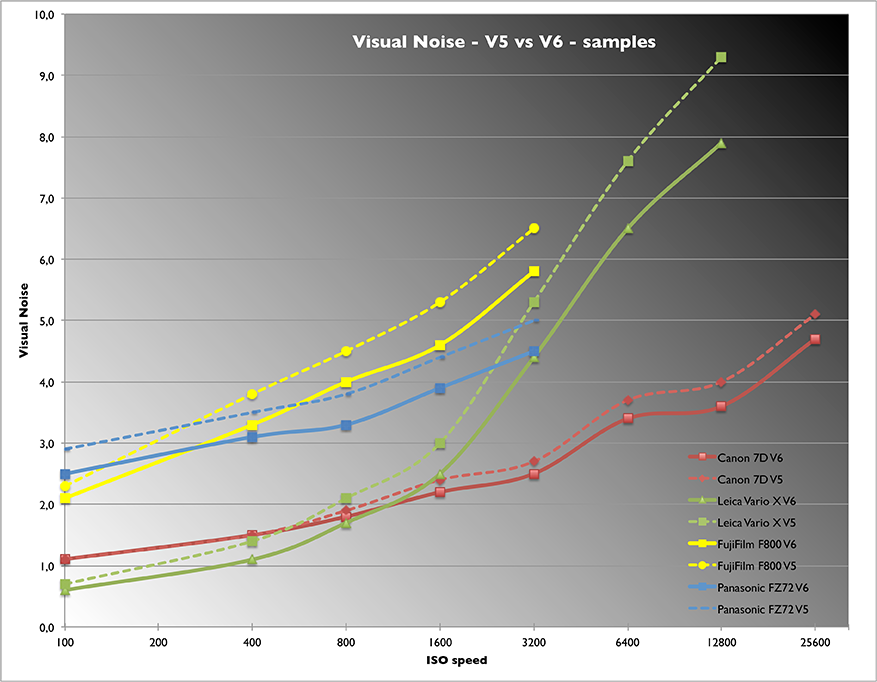
All differences together lower the resulting Visual Noise value between 10% and 15%. As you can see in the provided plot with 4 sample cameras, the lines do not cross, which means that the tendencies remain the same.
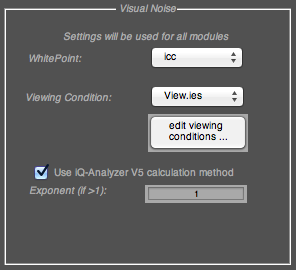
Even though we strongly recommend switching to the new reference implementation, we understand the constraints not to quickly change a running evaluation scheme. Therefore you can still use the old method in the iQ-Analyzer Version 6 if you enable the setting “Use iQ-Analyzer V5 calculation method” in the setting panel.
Uwe Artman